I. Executive Summary and Key Findings
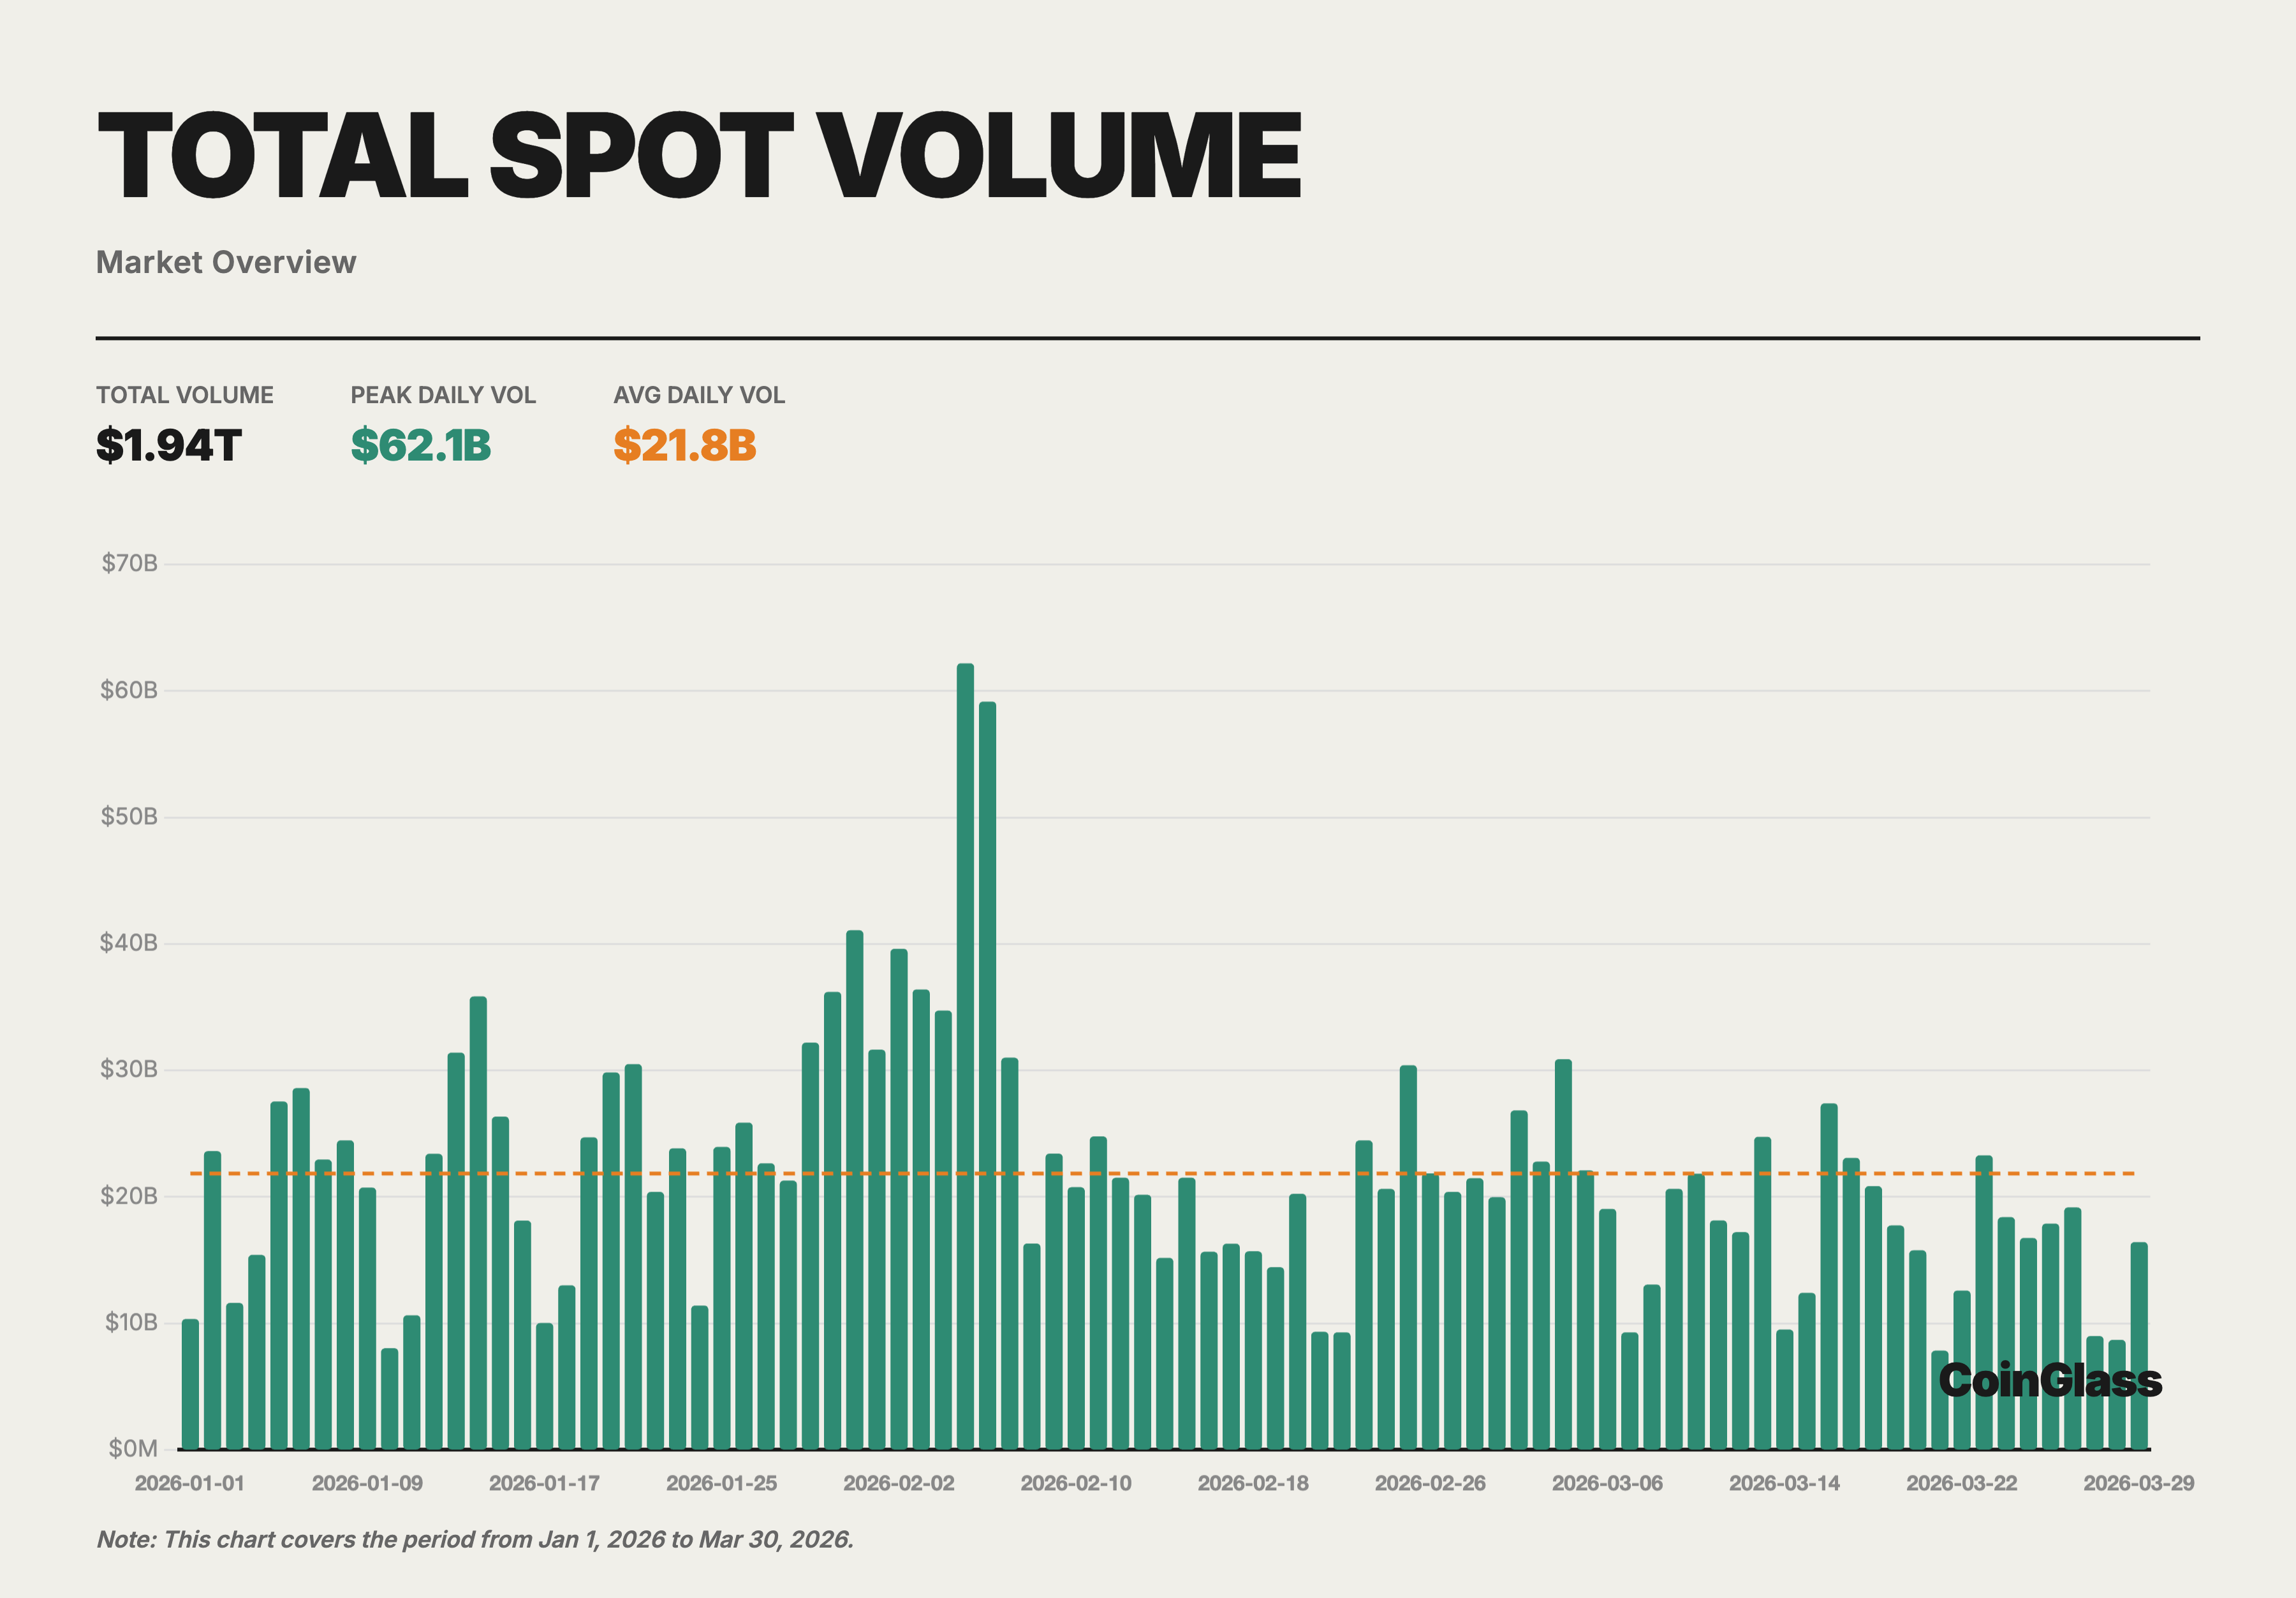
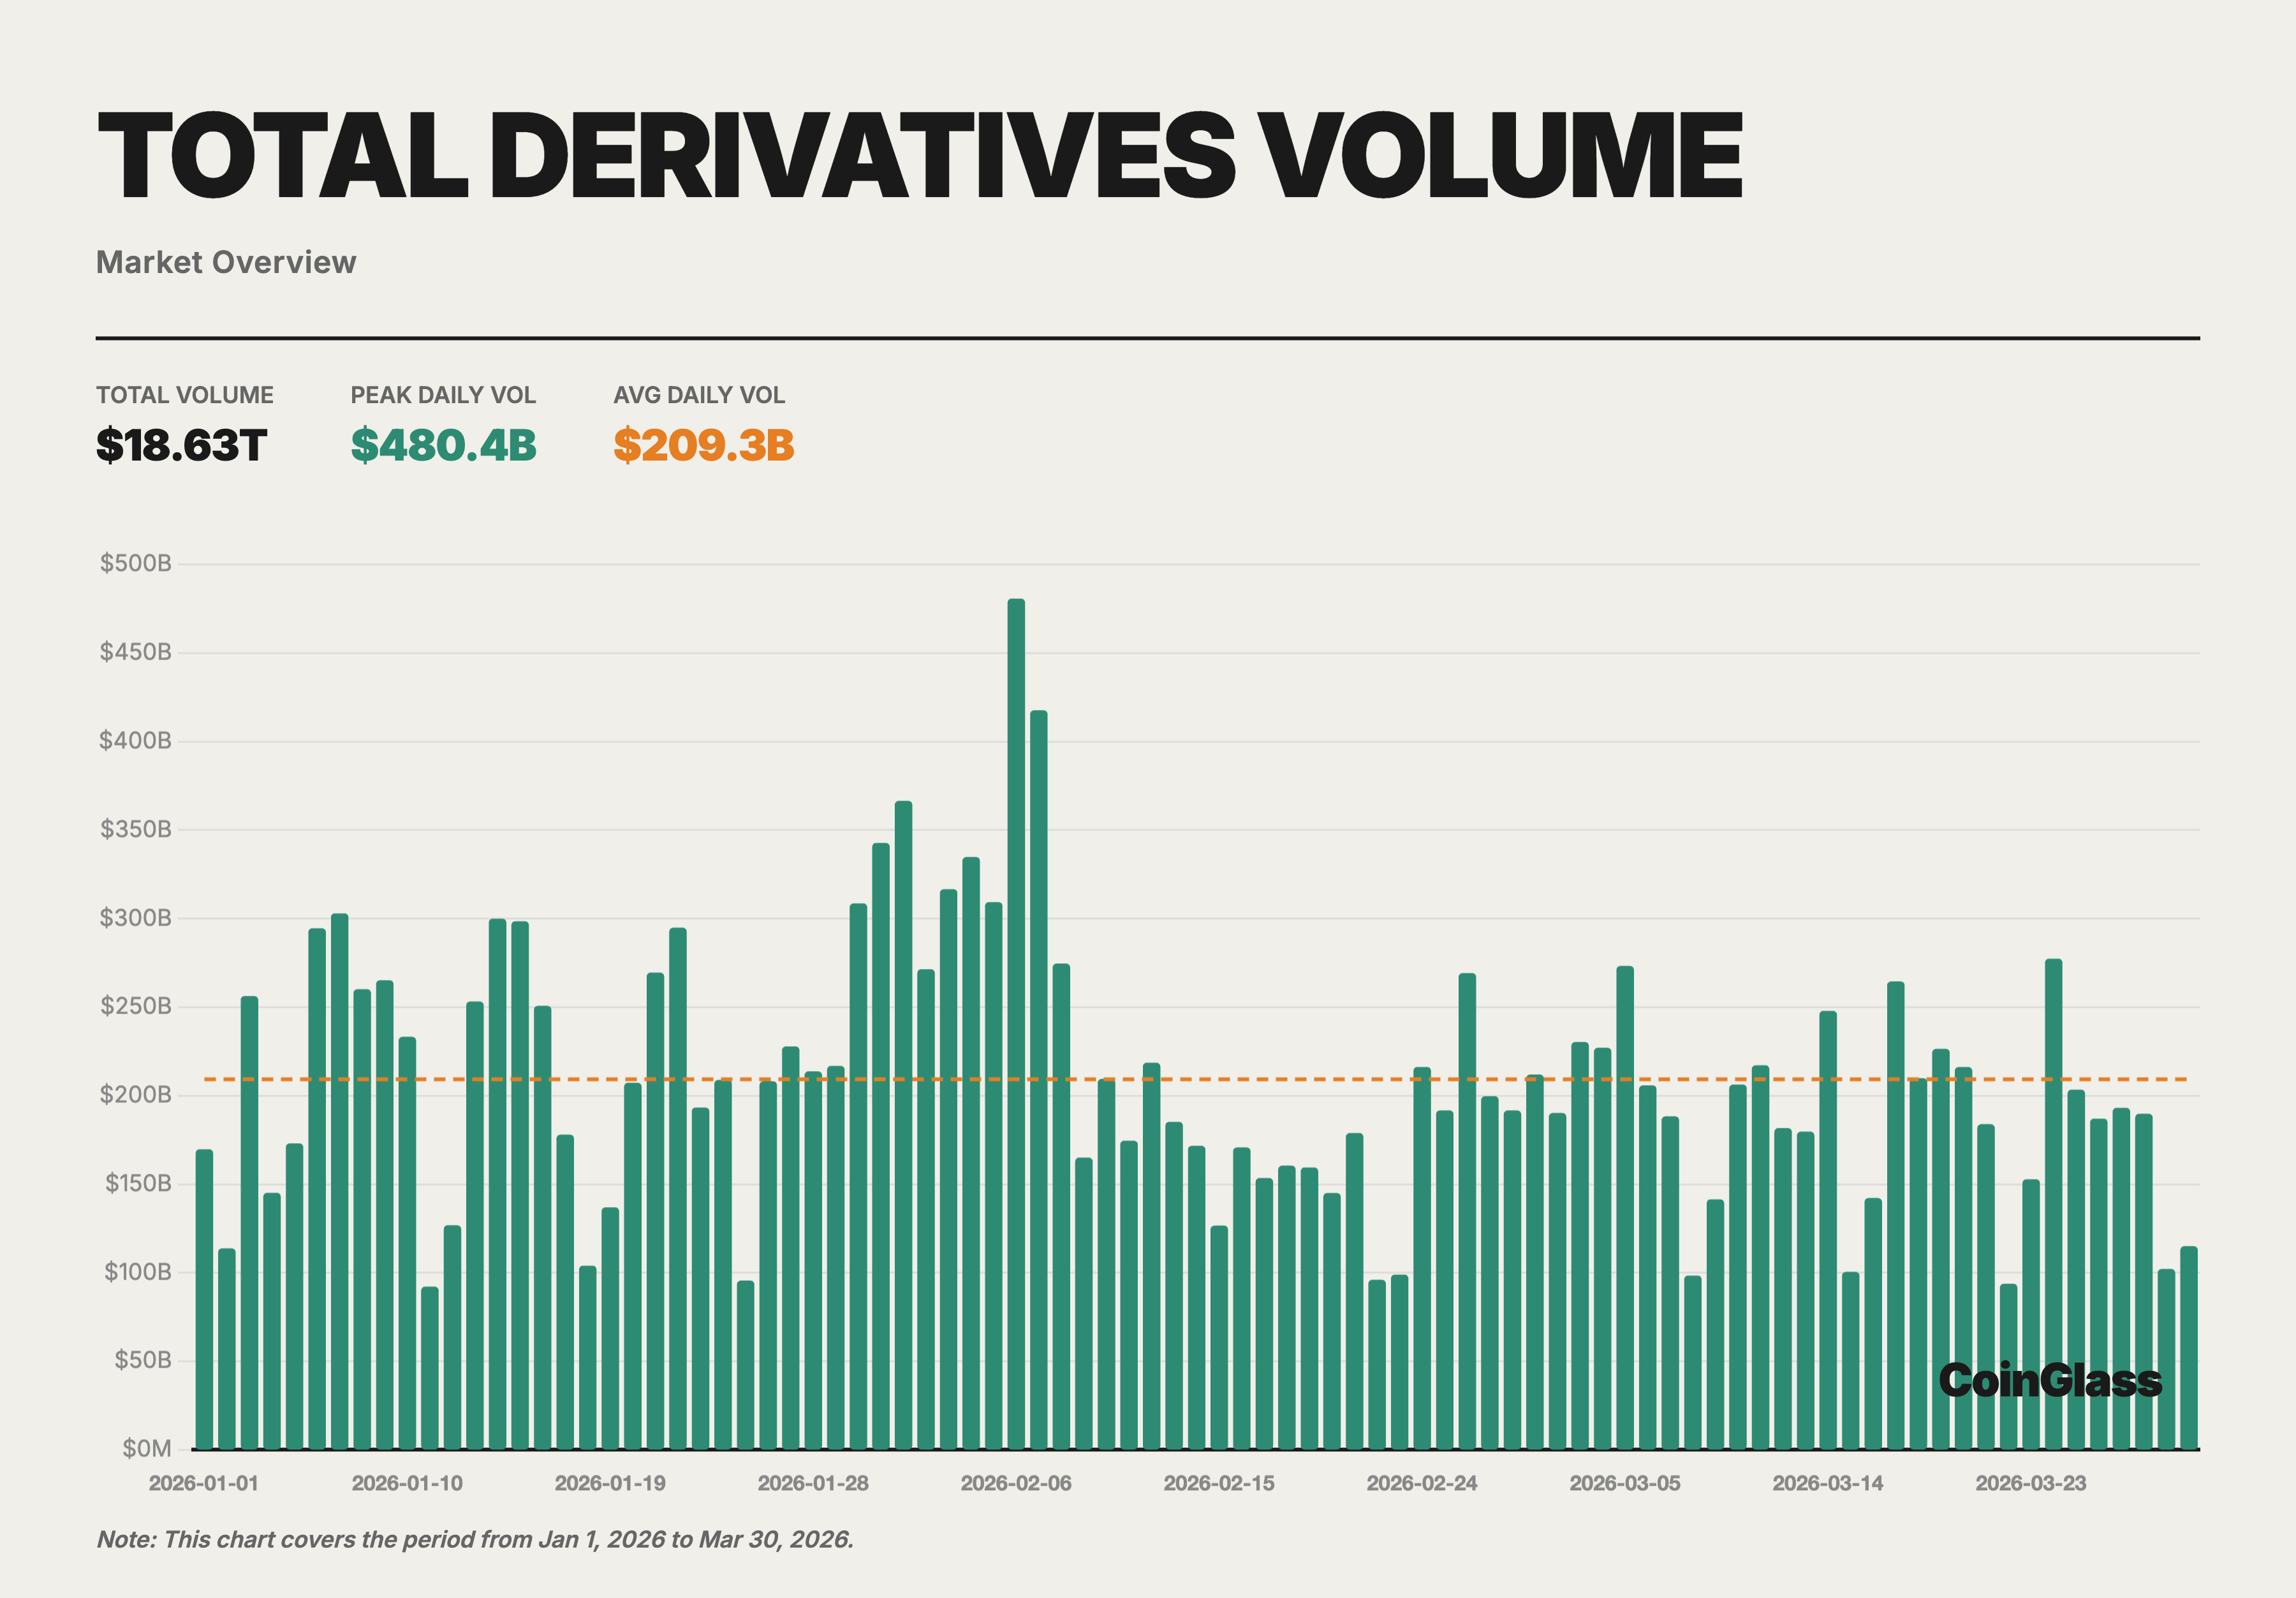
In Q1 2026, the overall cryptocurrency market maintained relatively high activity levels, though trading volumes gradually declined from their January highs. Total market spot volume in Q1 was approximately $1.94 trillion, derivatives volume approximately $18.63 trillion, totaling roughly $20.57 trillion, with a derivatives-to-spot ratio of about 9.6x. Structurally, market activity remained primarily concentrated in the derivatives market, while spot trading contracted by a relatively larger margin.
On core metrics, Binance continued to maintain its industry leadership. Derivatives trading volume reached approximately $4.90 trillion, corresponding to a share of about 34.9% among the Top 10 exchanges; average daily open interest was approximately $23.9 billion, corresponding to a share of about 29.9%; user asset reserves were approximately $152.9 billion, accounting for about 73.5% among major CEXs.
Compared with the second-ranked exchange, Binance’s derivatives volume was approximately 2.2x that of OKX, its average OI approximately 2.2x that of Bybit, and its user assets approximately 9.6x that of OKX. The data reflects that Binance’s leadership is not concentrated in a single dimension but is simultaneously manifest across trading volume, open interest, liquidity, and capital retention.
From the Top 5 competitive landscape, the market has formed a relatively clear tiered structure. In derivatives trading volume, Binance, OKX, Bybit, Gate, and Bitget rank in the top five respectively, with Bybit and Gate close in scale and OKX remaining the centralized platform closest to Binance.
In the open interest dimension, the second-tier ranking shifts to Bybit, Gate, OKX, and Bitget.
In user asset reserves, only OKX maintains above $10 billion after Binance, while Gate, Bitget, and Bybit all fall within the $5–7 billion range.
Overall, competition within the Top 5 is relatively robust, but a considerable gap persists between the leading platform and subsequent tiers.
II. Spot and Derivatives Trading Volume
2.1 Market-Wide Monthly Trading Volume Overview
In Q1 2026, total market-wide cryptocurrency trading volume (spot + derivatives) was approximately $20.57 trillion, comprising roughly $1.94 trillion in spot and $18.63 trillion in derivatives.
On a monthly basis, January had the highest total volume (spot $704.7 billion + derivatives $6.73 trillion), February saw a slight decline, and March contracted further to the quarterly low. This trend echoed the cautious sentiment in the concurrent global macro environment, as market risk appetite had not yet fully recovered following the severe deleveraging in Q4 2025.
The spot market averaged approximately $21.8 billion in daily volume, while the derivatives market averaged approximately $209.3 billion daily. The derivatives-to-spot ratio held steady at around 9.6x throughout Q1, slightly above the 2025 full-year average. This indicates that during market adjustment phases, traders are more inclined to use derivatives for hedging and short-term trading rather than making directional allocations in the spot market.
2.2 Spot Trading Volume and Market Share
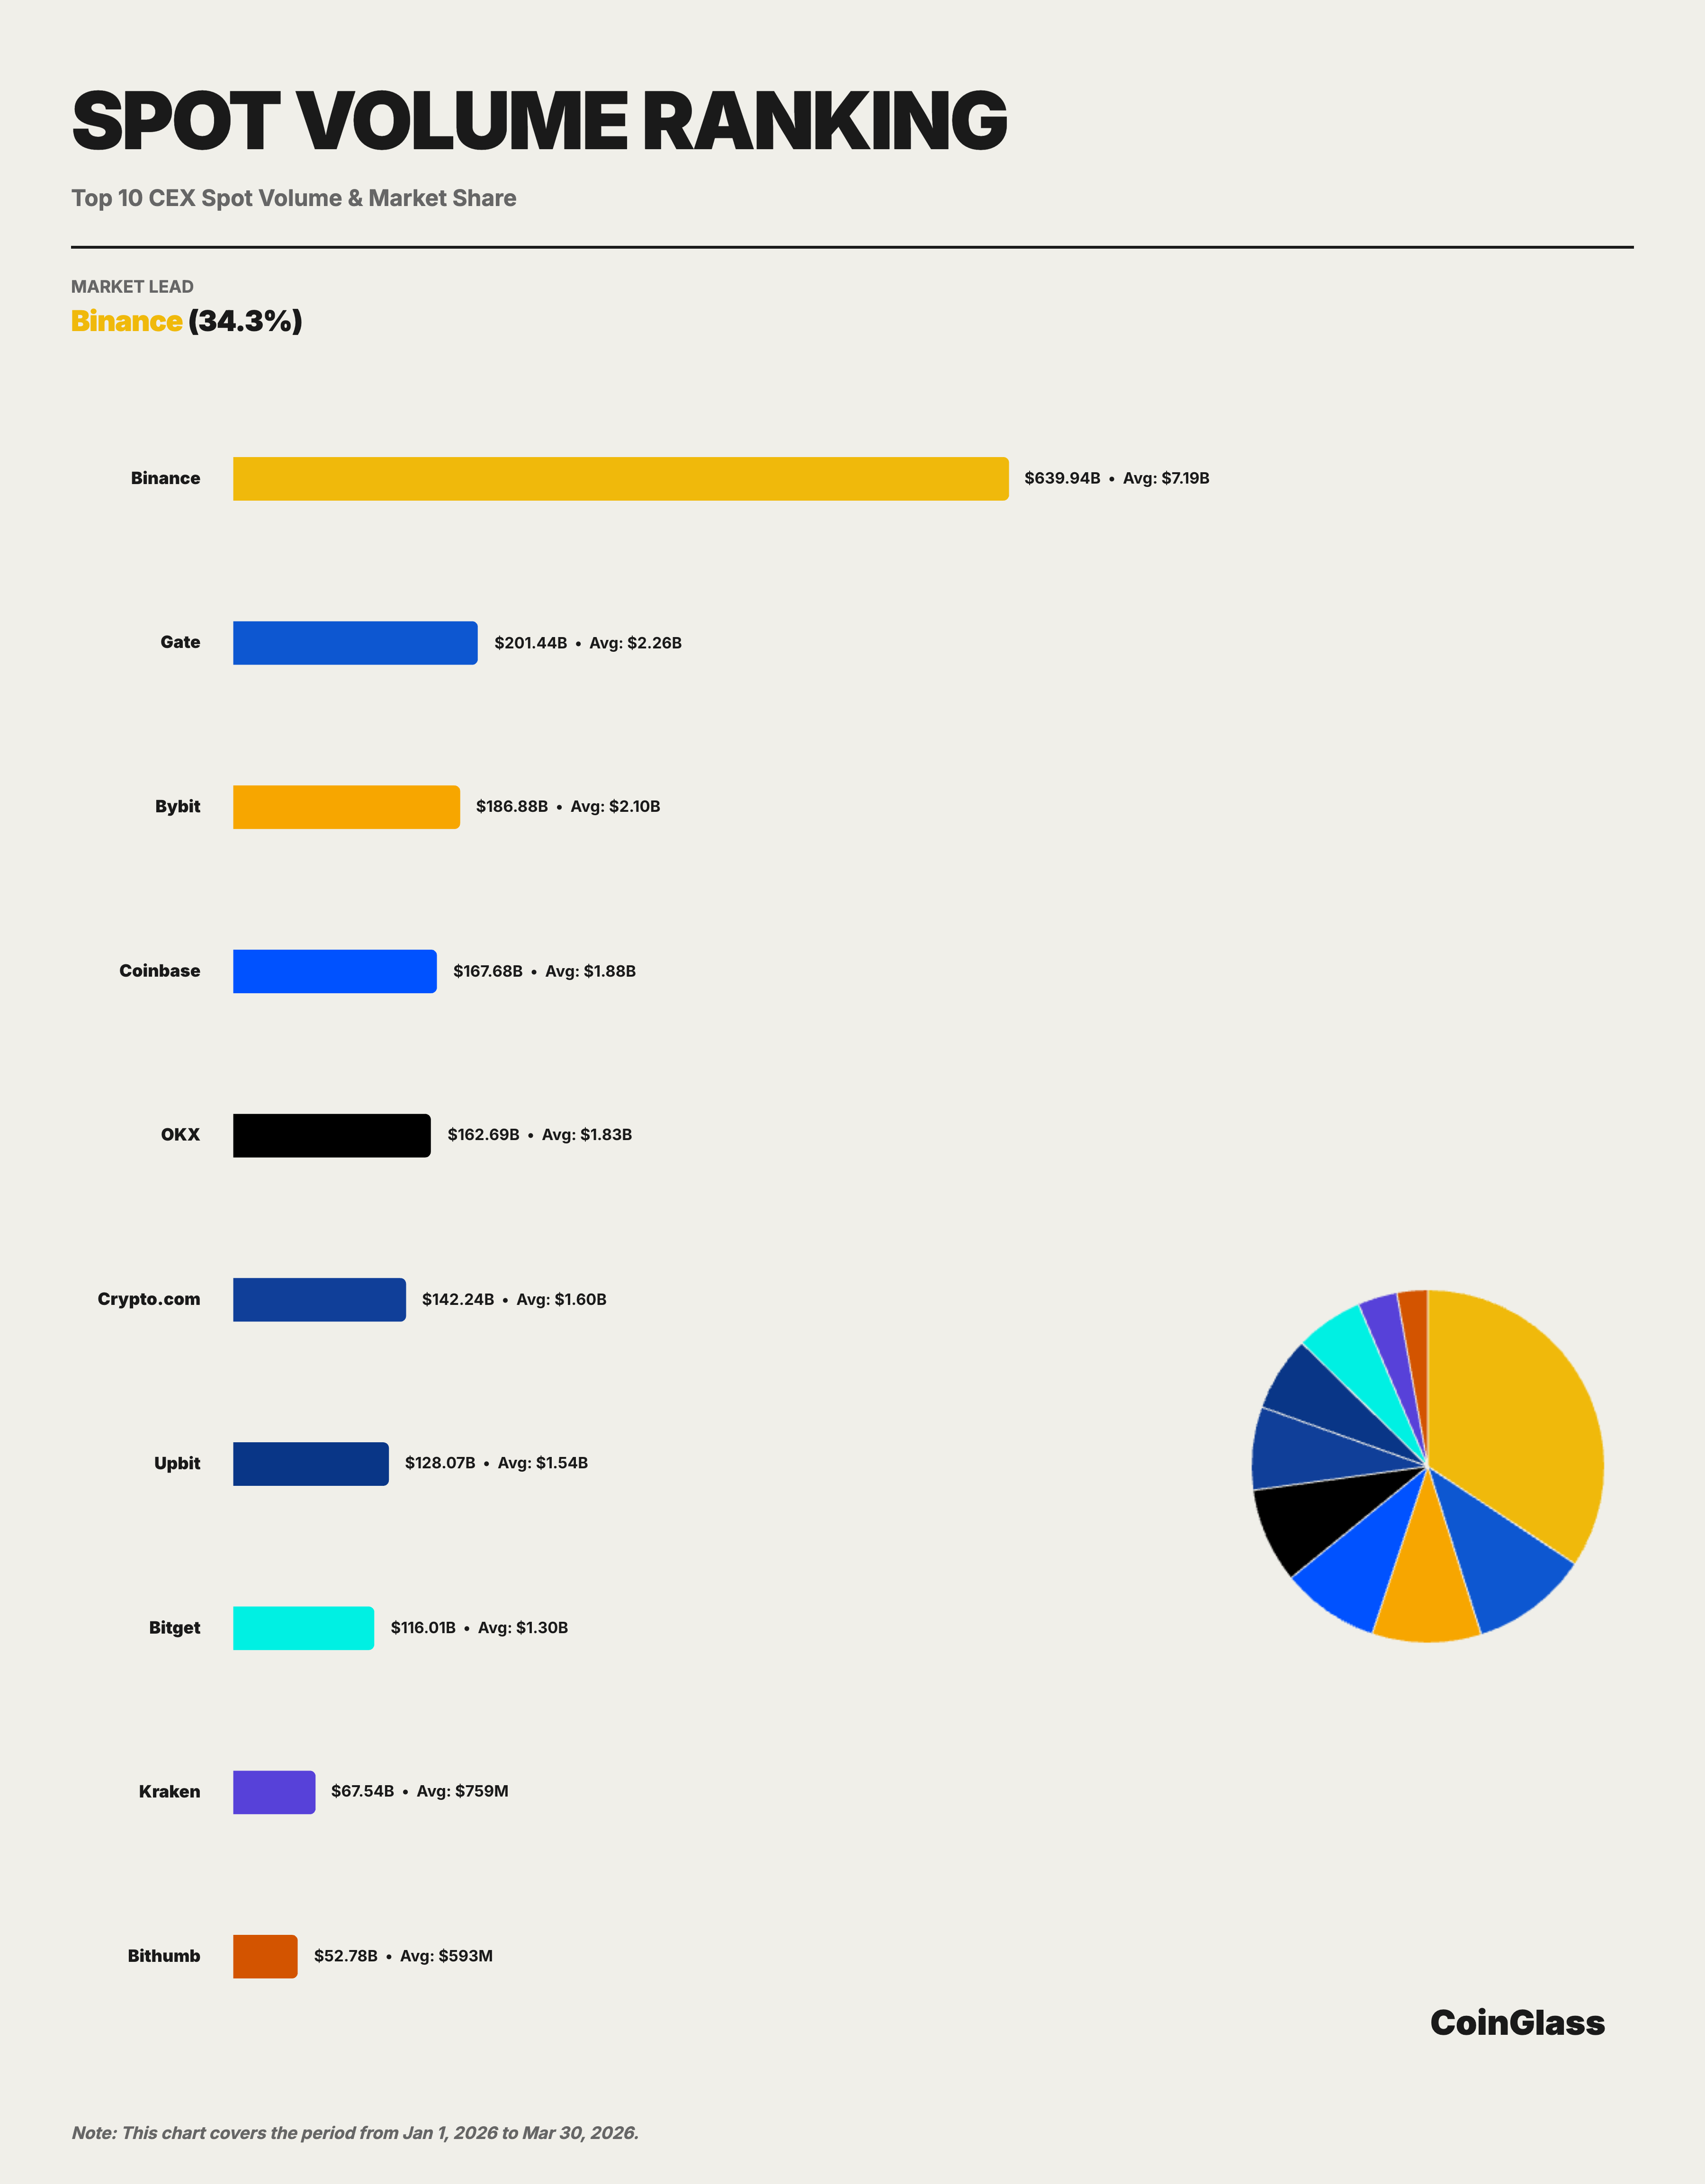
Binance’s cumulative Q1 spot volume was approximately $639.9 billion, corresponding to an average daily volume of about $7.19 billion and a market share of approximately 34.3% on a Top 10 basis.
On a monthly trend basis, Binance’s share among the spot Top 10 exchanges remained broadly stable: 34.0% in January 2026, 33.7% in February, and rising to 35.4% in March. Despite total market volume contracting from $704.7 billion in January to $542.0 billion in March—a decline of 23%—Binance’s share actually edged upward. This suggests that although the spot market declined overall, top-tier liquidity continued to concentrate toward a handful of platforms.
Extending the competitive landscape to the Top 5, the spot market’s distribution is notably more dispersed than that of derivatives. The top five platforms by cumulative Q1 spot volume were Binance, Gate, Bybit, Coinbase, and OKX, with respective volumes of approximately $639.9 billion, $201.4 billion, $186.9 billion, $167.7 billion, and $162.7 billion.
On a total market basis, the remaining four platforms each held shares roughly in the 8–10% range. In other words, Binance’s leadership in the spot market is clear, but compared to the derivatives market, the second tier in spot is more evenly distributed and competition more dispersed.
2.3 Derivatives Trading Volume and Market Share
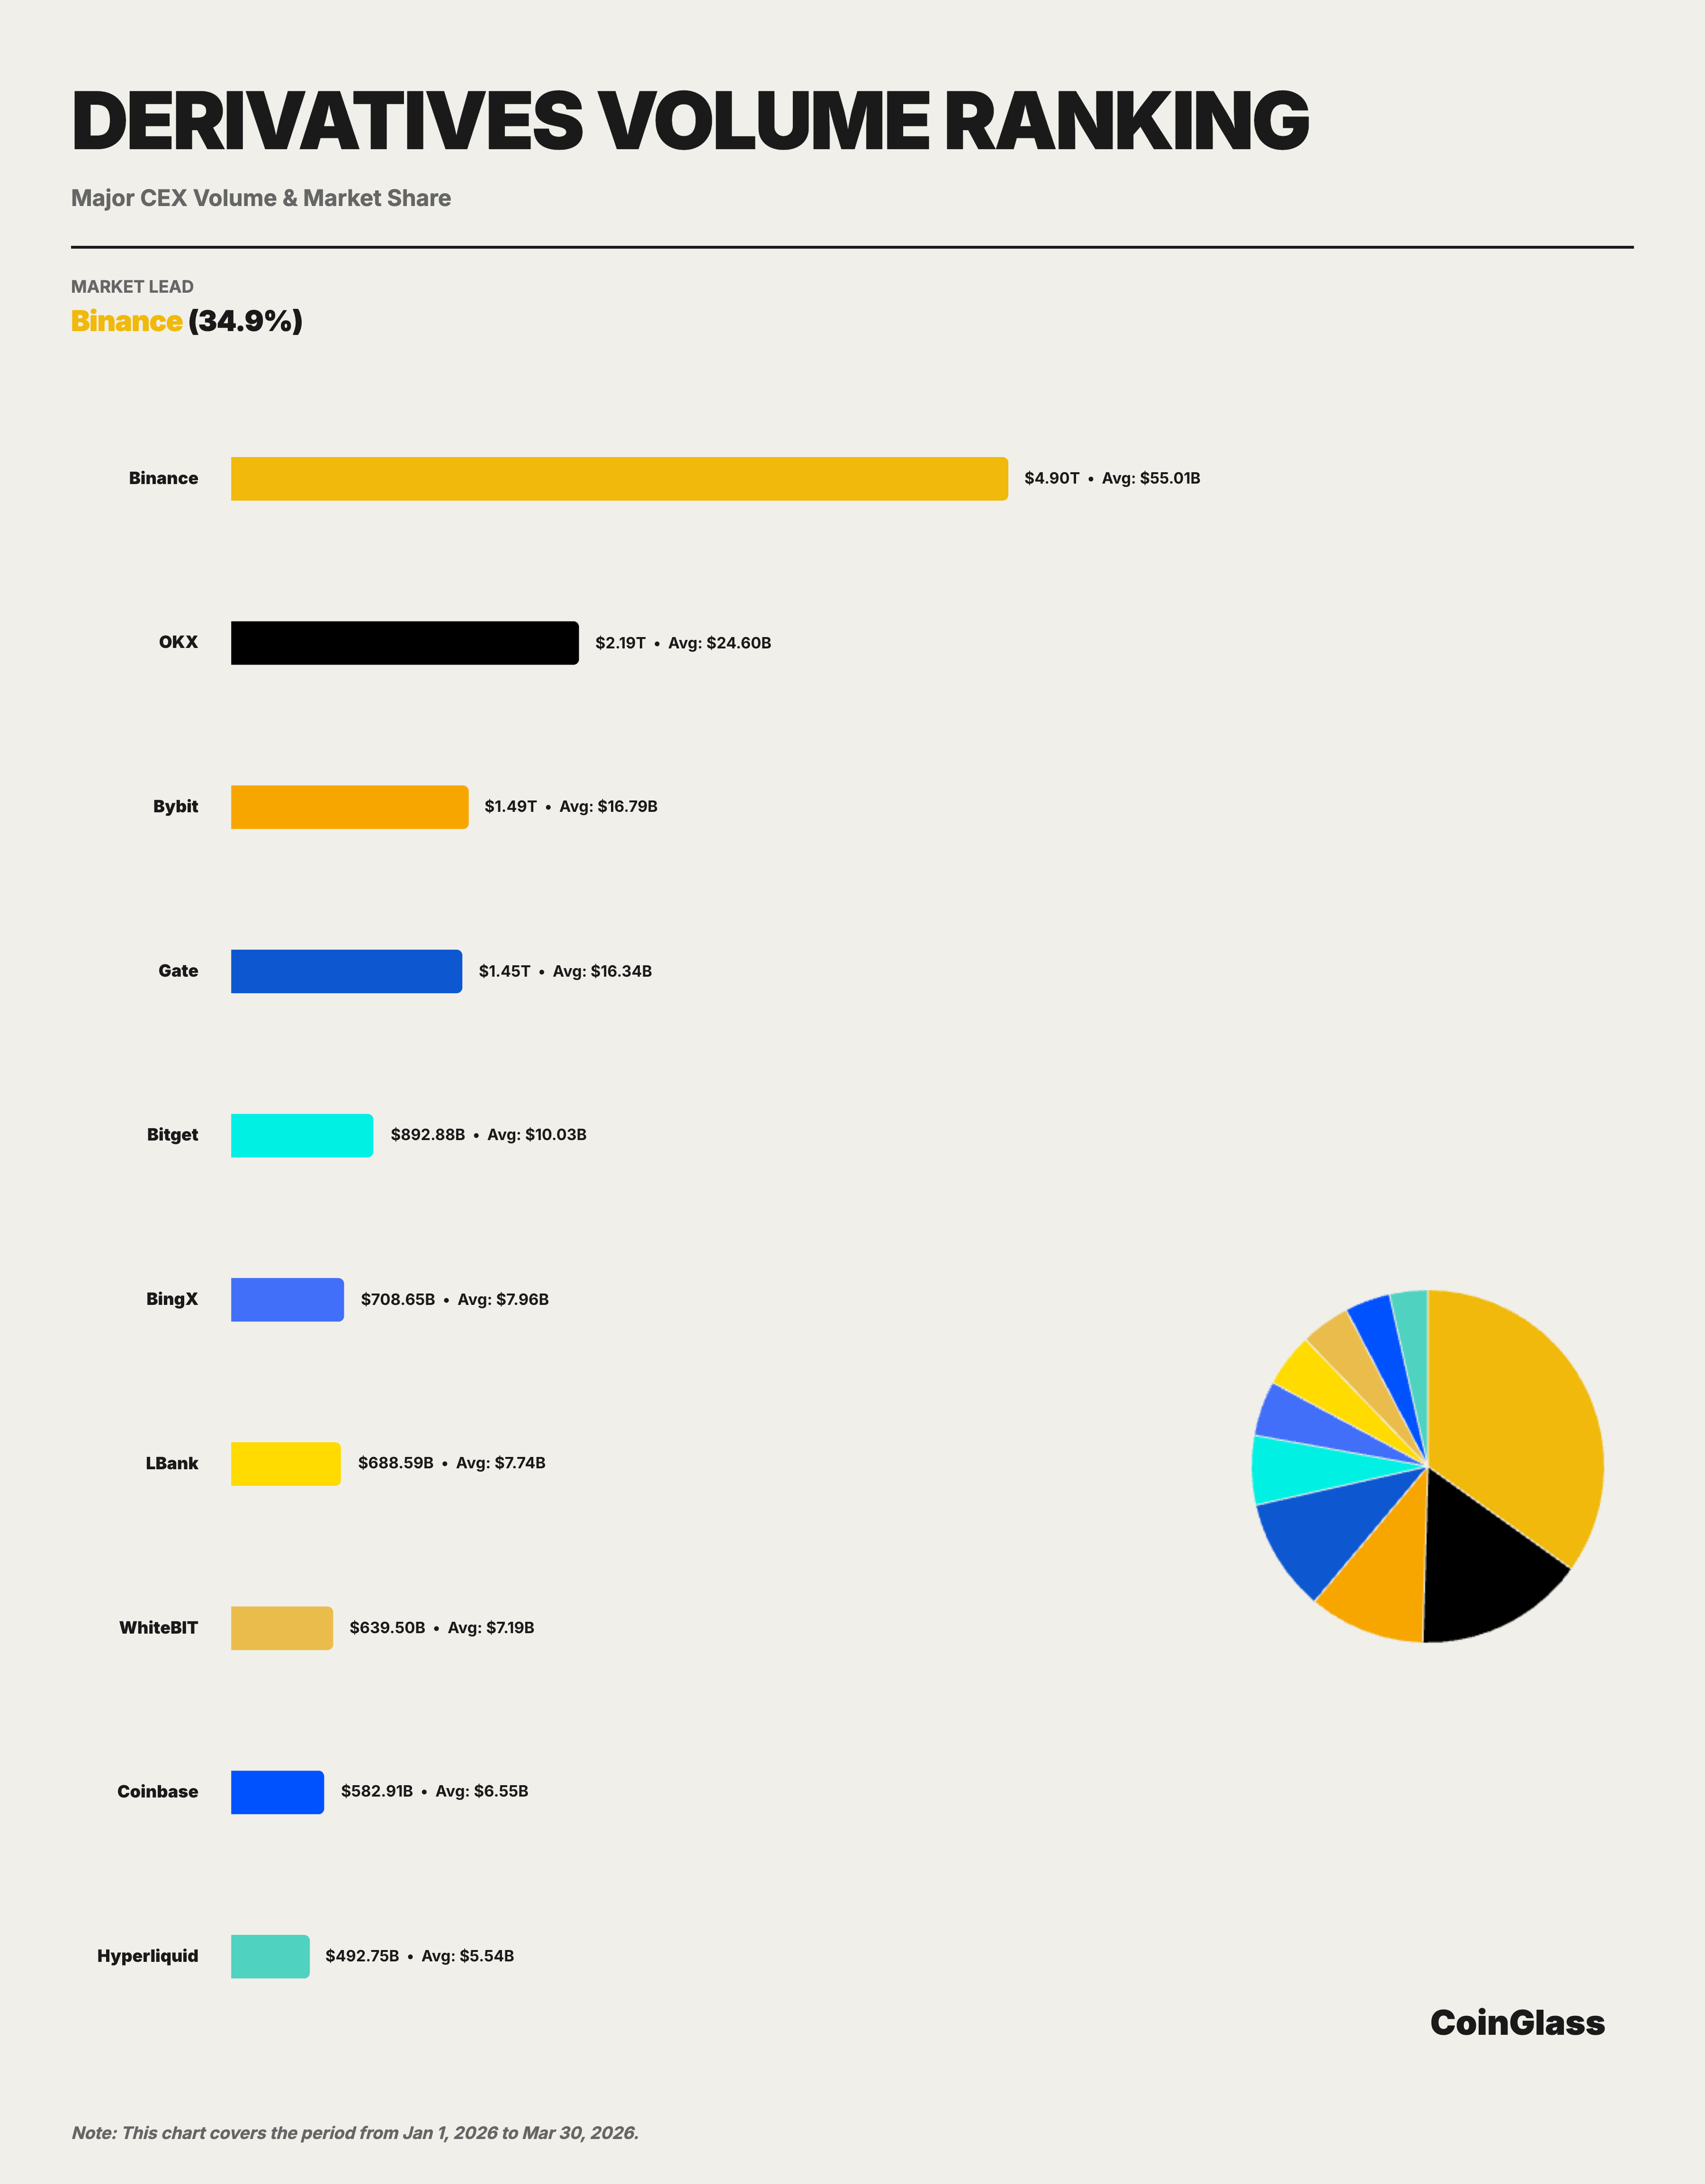
Binance’s cumulative Q1 derivatives volume was approximately $4.90 trillion, with an average daily volume of about $55.0 billion. Among the Top 10 exchanges, Binance held a share of 34.9%, firmly in first place, with its trading volume exceeding the combined total of second-ranked OKX ($2.19 trillion) and third-ranked Bybit ($1.49 trillion).
On a monthly trend basis, Binance’s share among the derivatives Top 10 exchanges was broadly stable: 33.2% in January 2026, rising to 35.8% in February, and holding at 35.7% in March. This post-decline recovery trajectory aligns with the process of market liquidity flowing back to top platforms following the Q4 2025 deleveraging shock. In other words, trading volume briefly dispersed across platforms at the start of the quarter, but as the market gradually stabilized, liquidity continued to flow back to platforms with greater depth and execution efficiency. Binance demonstrated stronger absorption capacity during this recovery.
OKX is currently the centralized platform closest to Binance, yet its trading volume is still only about 45% of Binance’s. Bybit and Gate are similar in scale, forming the middle of the second tier. While Bitget maintains a stable Top 5 position, a notable gap has emerged between it and the top four. In relative terms, Binance’s derivatives volume is approximately 3.3x that of Bybit, 3.4x that of Gate, and 5.5x that of Bitget.
2.4 Competitive Landscape Comparison
Examining spot and derivatives within a unified framework reveals significant differences in competitive dynamics. In the spot market, Binance maintains first place, but the second tier is jointly composed of Gate, Bybit, Coinbase, and OKX with relatively similar shares.
In the derivatives market, Binance’s lead is more pronounced, and a distinct hierarchy has formed between second-ranked OKX and the third and fourth positions. Binance’s leadership in derivatives is thus more concentrated, while the spot market exhibits a “first place plus dispersed second tier” structure.
From a platform positioning perspective, OKX holds a stable second place in derivatives volume and is the closest challenger to Binance. Bybit and Gate compete at a similar level—the former enjoys strong participation among globally active traders, while the latter maintains a notable presence in volume and open interest metrics. Beyond the Top 5, BingX, LBank, WhiteBIT, Coinbase, and Hyperliquid maintain substantial trading activity but remain at a lower overall scale compared to the top five.
Notably, decentralized derivatives platforms have entered the mainstream comparison landscape.
Hyperliquid’s Q1 derivatives trading volume was approximately $492.7 billion, placing it in the top ten, with an average open interest of about $6.0 billion. This means on-chain derivatives are no longer merely a fringe supplement but have begun to form real competition in certain market segments. However, in terms of current scale, their overall volume remains significantly lower than that of leading centralized platforms such as Binance, OKX, Bybit, and Gate.
III. Derivatives Open Interest
3.1 Market-Wide Open Interest Trends
In Q1 2026, market-wide derivatives open interest (OI) averaged approximately $117.2 billion daily, with the quarterly peak occurring on January 15 at approximately $152.5 billion. On a monthly trend basis, January averaged about $141.1 billion in daily OI, February fell sharply to approximately $102.6 billion (a decline of about 27%), and March saw a slight recovery to about $106.0 billion.
3.2 OI Share and Ranking Changes
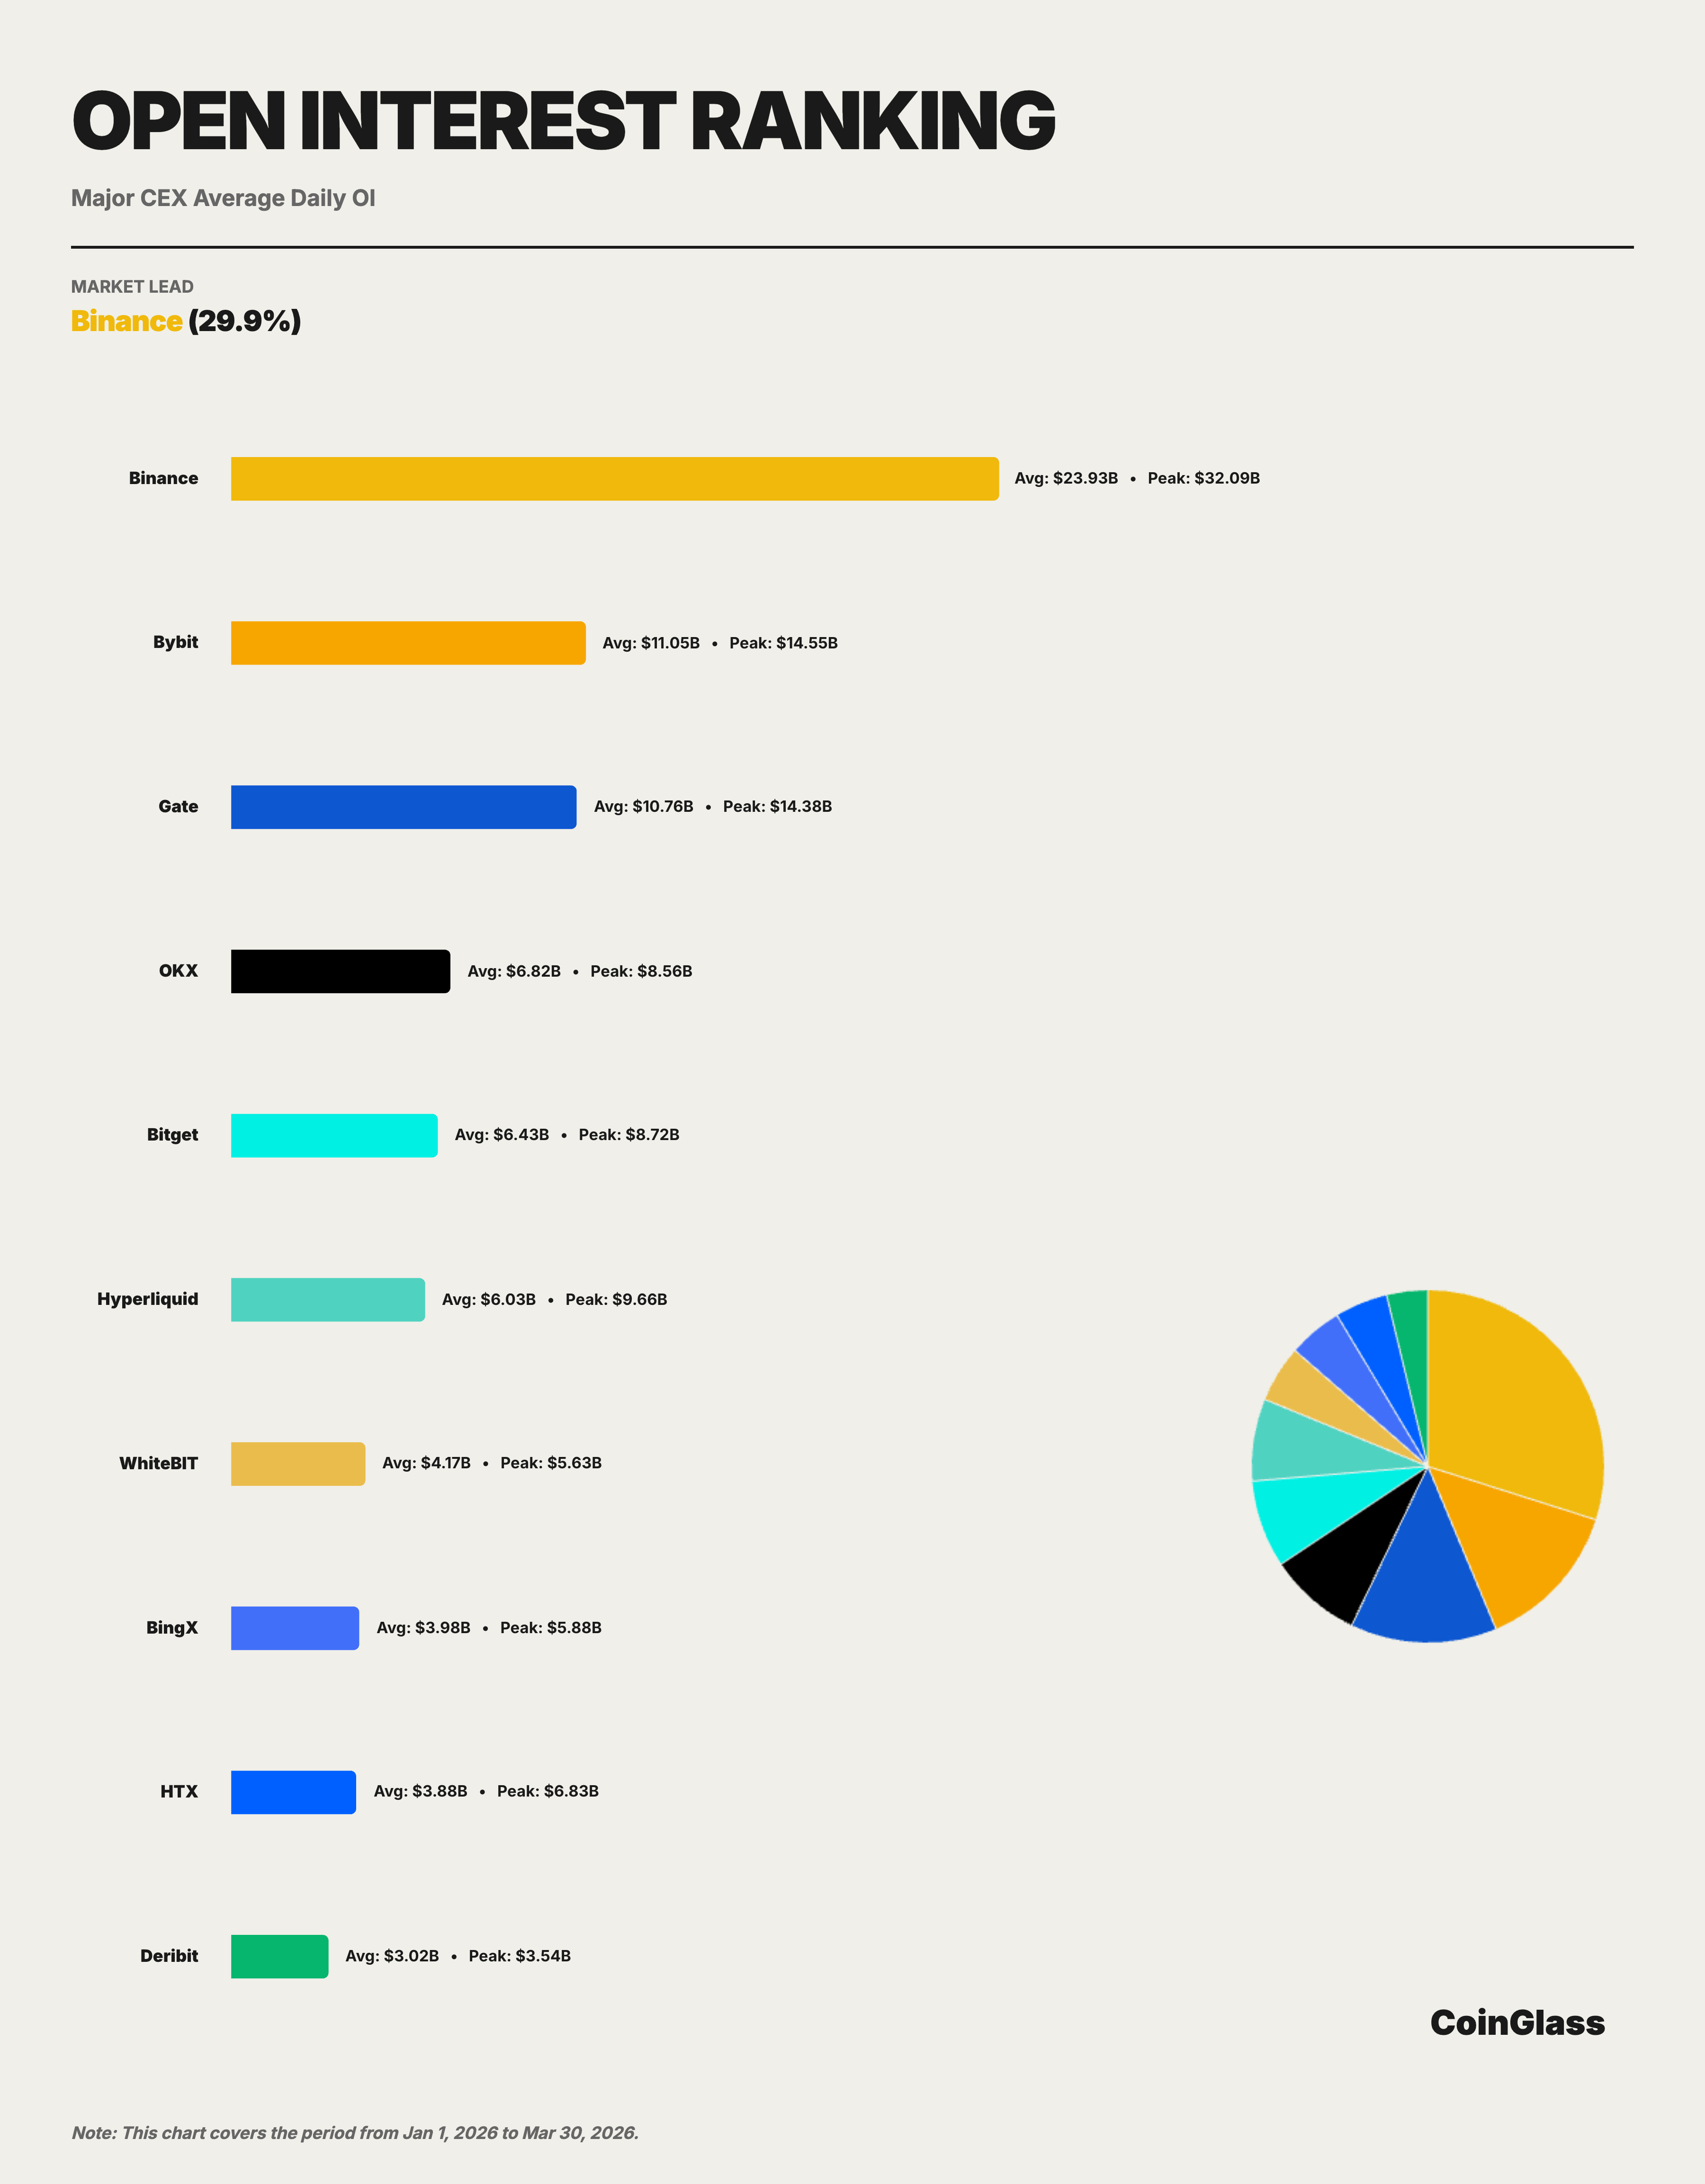
Binance’s average Q1 OI was approximately $23.9 billion, corresponding to a share of about 29.9% among the Top 10 exchanges, ranking first. Second through fifth positions were held by Bybit, Gate, OKX, and Bitget, with average OI of approximately $11.0 billion, $10.8 billion, $6.8 billion, and $6.4 billion respectively. Binance’s average OI was approximately 2.2x that of Bybit, 2.2x that of Gate, 3.5x that of OKX, and 3.7x that of Bitget, demonstrating a clear lead.
Binance’s OI share remained within the 20–21% range (total market) throughout the quarter, with limited fluctuation, indicating that its market position in the open interest dimension is fundamentally stable. More notably, Binance’s peak OI of approximately $32.1 billion was about 2.2x the peak of second-ranked Bybit ($14.5 billion), demonstrating Binance’s capacity to absorb greater position volume during periods of heightened market volatility.
3.3 Market Structure Analysis
The open interest market structure displays characteristics distinct from trading volume. In the volume dimension, Binance leads the second-ranked exchange by more than 19 percentage points; however, in the OI dimension, the gap between Binance (29.9%), Bybit (13.8%), Gate (13.4%), and OKX (8.5%) has narrowed. This reflects that different platforms possess their own competitive advantages in attracting longer-term position holding.
Hyperliquid’s open interest scale deserves special attention. With an average daily OI of approximately $6.0 billion and a peak approaching $9.7 billion, it has drawn close to Bitget and surpassed platforms such as WhiteBIT and BingX. The growth of on-chain platforms in the OI dimension indicates their increasing attractiveness for high-leverage and strategy-based trading.
In the short term, this trend is not yet sufficient to challenge Binance’s leading position, but for second-tier platforms, the entry of on-chain competitors is increasing the complexity of future market share competition. As a decentralized derivatives protocol, its rapid growth in open interest further validates the 2025 annual report’s assessment that “decentralized derivatives are transitioning from proof-of-concept to actual market share competition.”
IV. Liquidity Depth
This chapter is based on order book snapshot data, comparing the ±1% two-sided depth of major platforms in BTC and ETH spot and futures markets. Compared to trading volume and OI, depth more directly reflects a platform’s true capacity to execute large trades, making it a key indicator for assessing whether a leading platform’s dominance is “quality-driven.”
4.1 BTC Market Depth
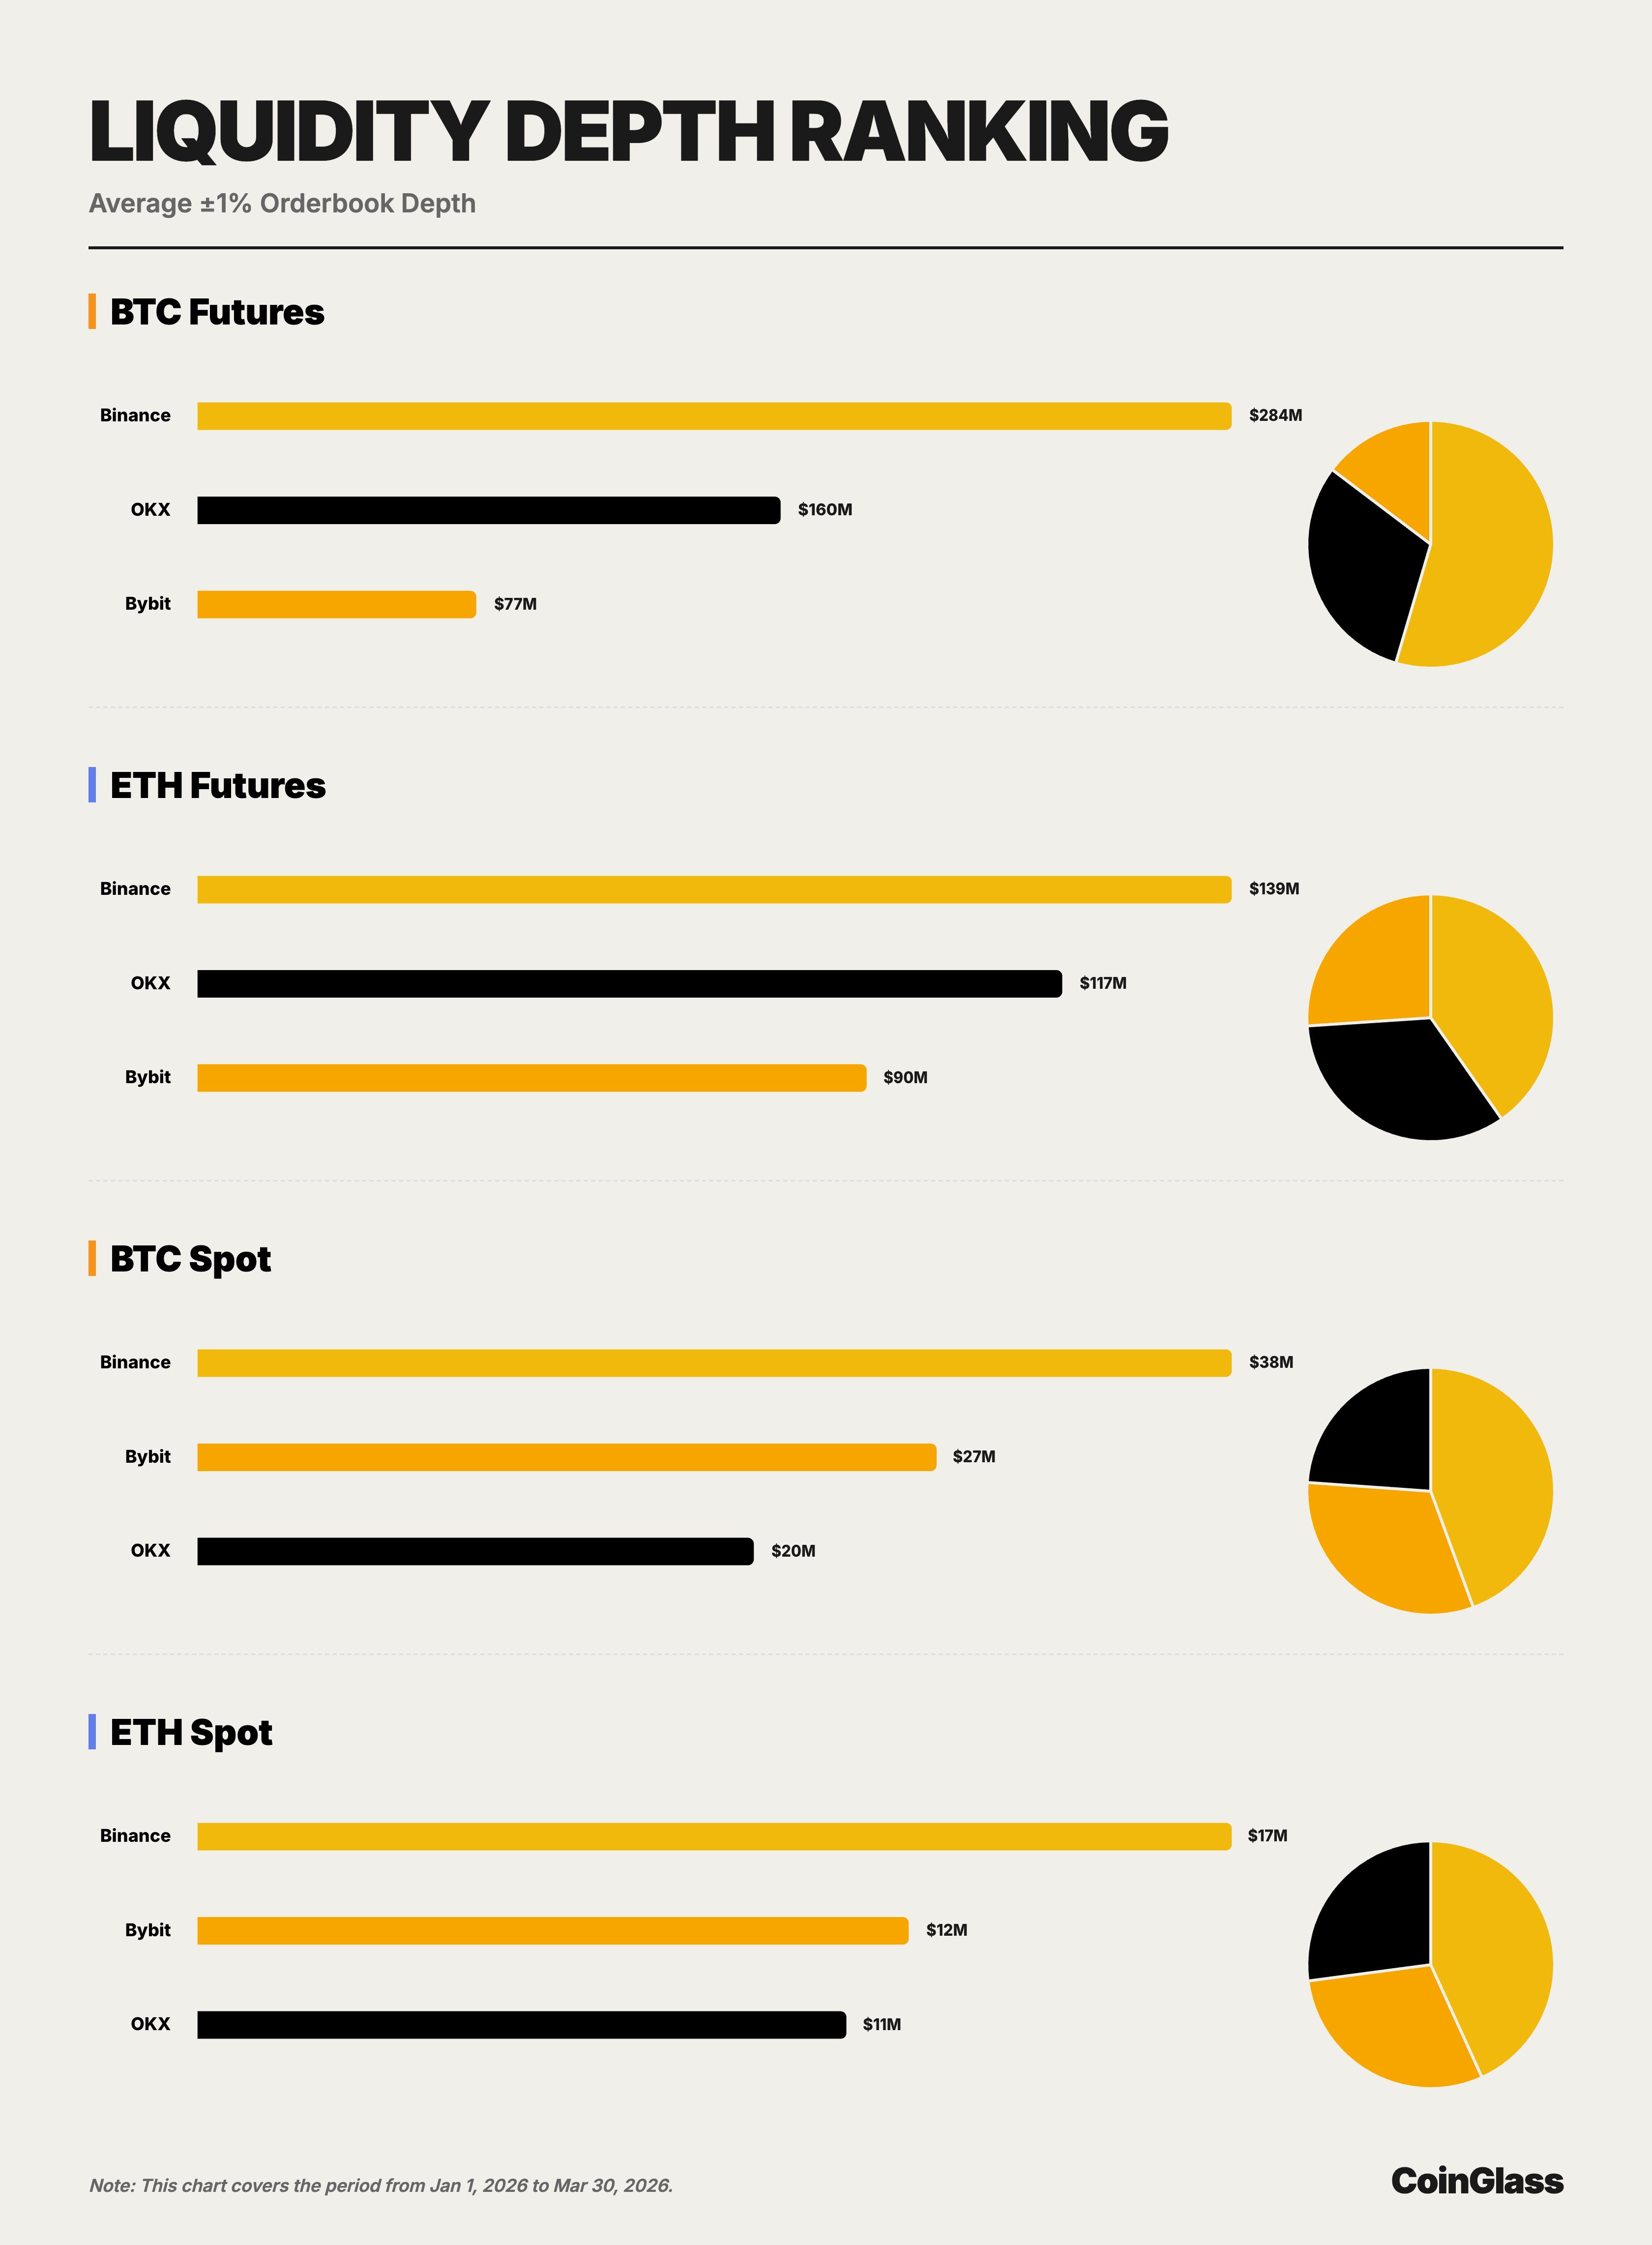
In the BTC futures market, Binance, OKX, and Bybit had average ±1% two-sided depths of approximately $284 million, $160 million, and $76.55 million respectively.
Binance was approximately 1.8x OKX and 3.7x Bybit, maintaining a significant lead. From an institutional trading perspective, this means Binance can absorb larger order sizes in the BTC futures market without excessively amplifying market impact costs—its liquidity advantage carries direct execution value.
In the BTC spot market, Binance, Bybit, and OKX had average ±1% two-sided depths of approximately $37.54 million, $26.82 million, and $20.18 million respectively.
Unlike the futures market, Bybit rather than OKX holds the second position in BTC spot depth, though Binance still leads Bybit by about 40% and OKX by about 86%. This indicates that Binance holds the top position in both of BTC’s most critical liquidity pools (spot and futures), while the second-ranked platform rotates between different sub-markets.
4.2 ETH Market Depth
In the ETH futures market, Binance, OKX, and Bybit had average ±1% two-sided depths of approximately $139 million, $117 million, and $90.15 million respectively.
Compared to BTC futures, competition among top platforms in ETH futures is closer—the gap between OKX and Binance narrows to about 16%, and between Bybit and Binance to about 35%. Even so, Binance maintains the top position, demonstrating that its leadership extends beyond a single asset like BTC into the ETH futures market as well.
In the ETH spot market, Binance, Bybit, and OKX had average ±1% two-sided depths of approximately $16.84 million, $11.58 million, and $10.57 million respectively.
Similar to the BTC spot market, Bybit holds the second position, but Binance leads Bybit by about 45% and OKX by about 59%. The results show that Binance ranks first across all four core sub-markets, with the second position alternating between OKX and Bybit, further demonstrating that Binance’s advantage has greater breadth rather than being concentrated in any particular asset or market.
4.3 Relationship Between Depth and Trading Volume
From an execution capability perspective, depth is typically a better measure of a platform’s true liquidity quality than trading volume. Q1 data shows that Binance not only leads in spot and derivatives trading volume but also commands the best depth across BTC and ETH’s primary trading venues.
OKX is more competitive in futures depth, while Bybit performs closer to the top in spot depth. However, no platform currently exerts comprehensive pressure on Binance across all four core sub-markets simultaneously, meaning Binance’s leadership possesses strong structural stability.
V. User Asset Reserves
5.1 Asset Reserve Scale and Trends
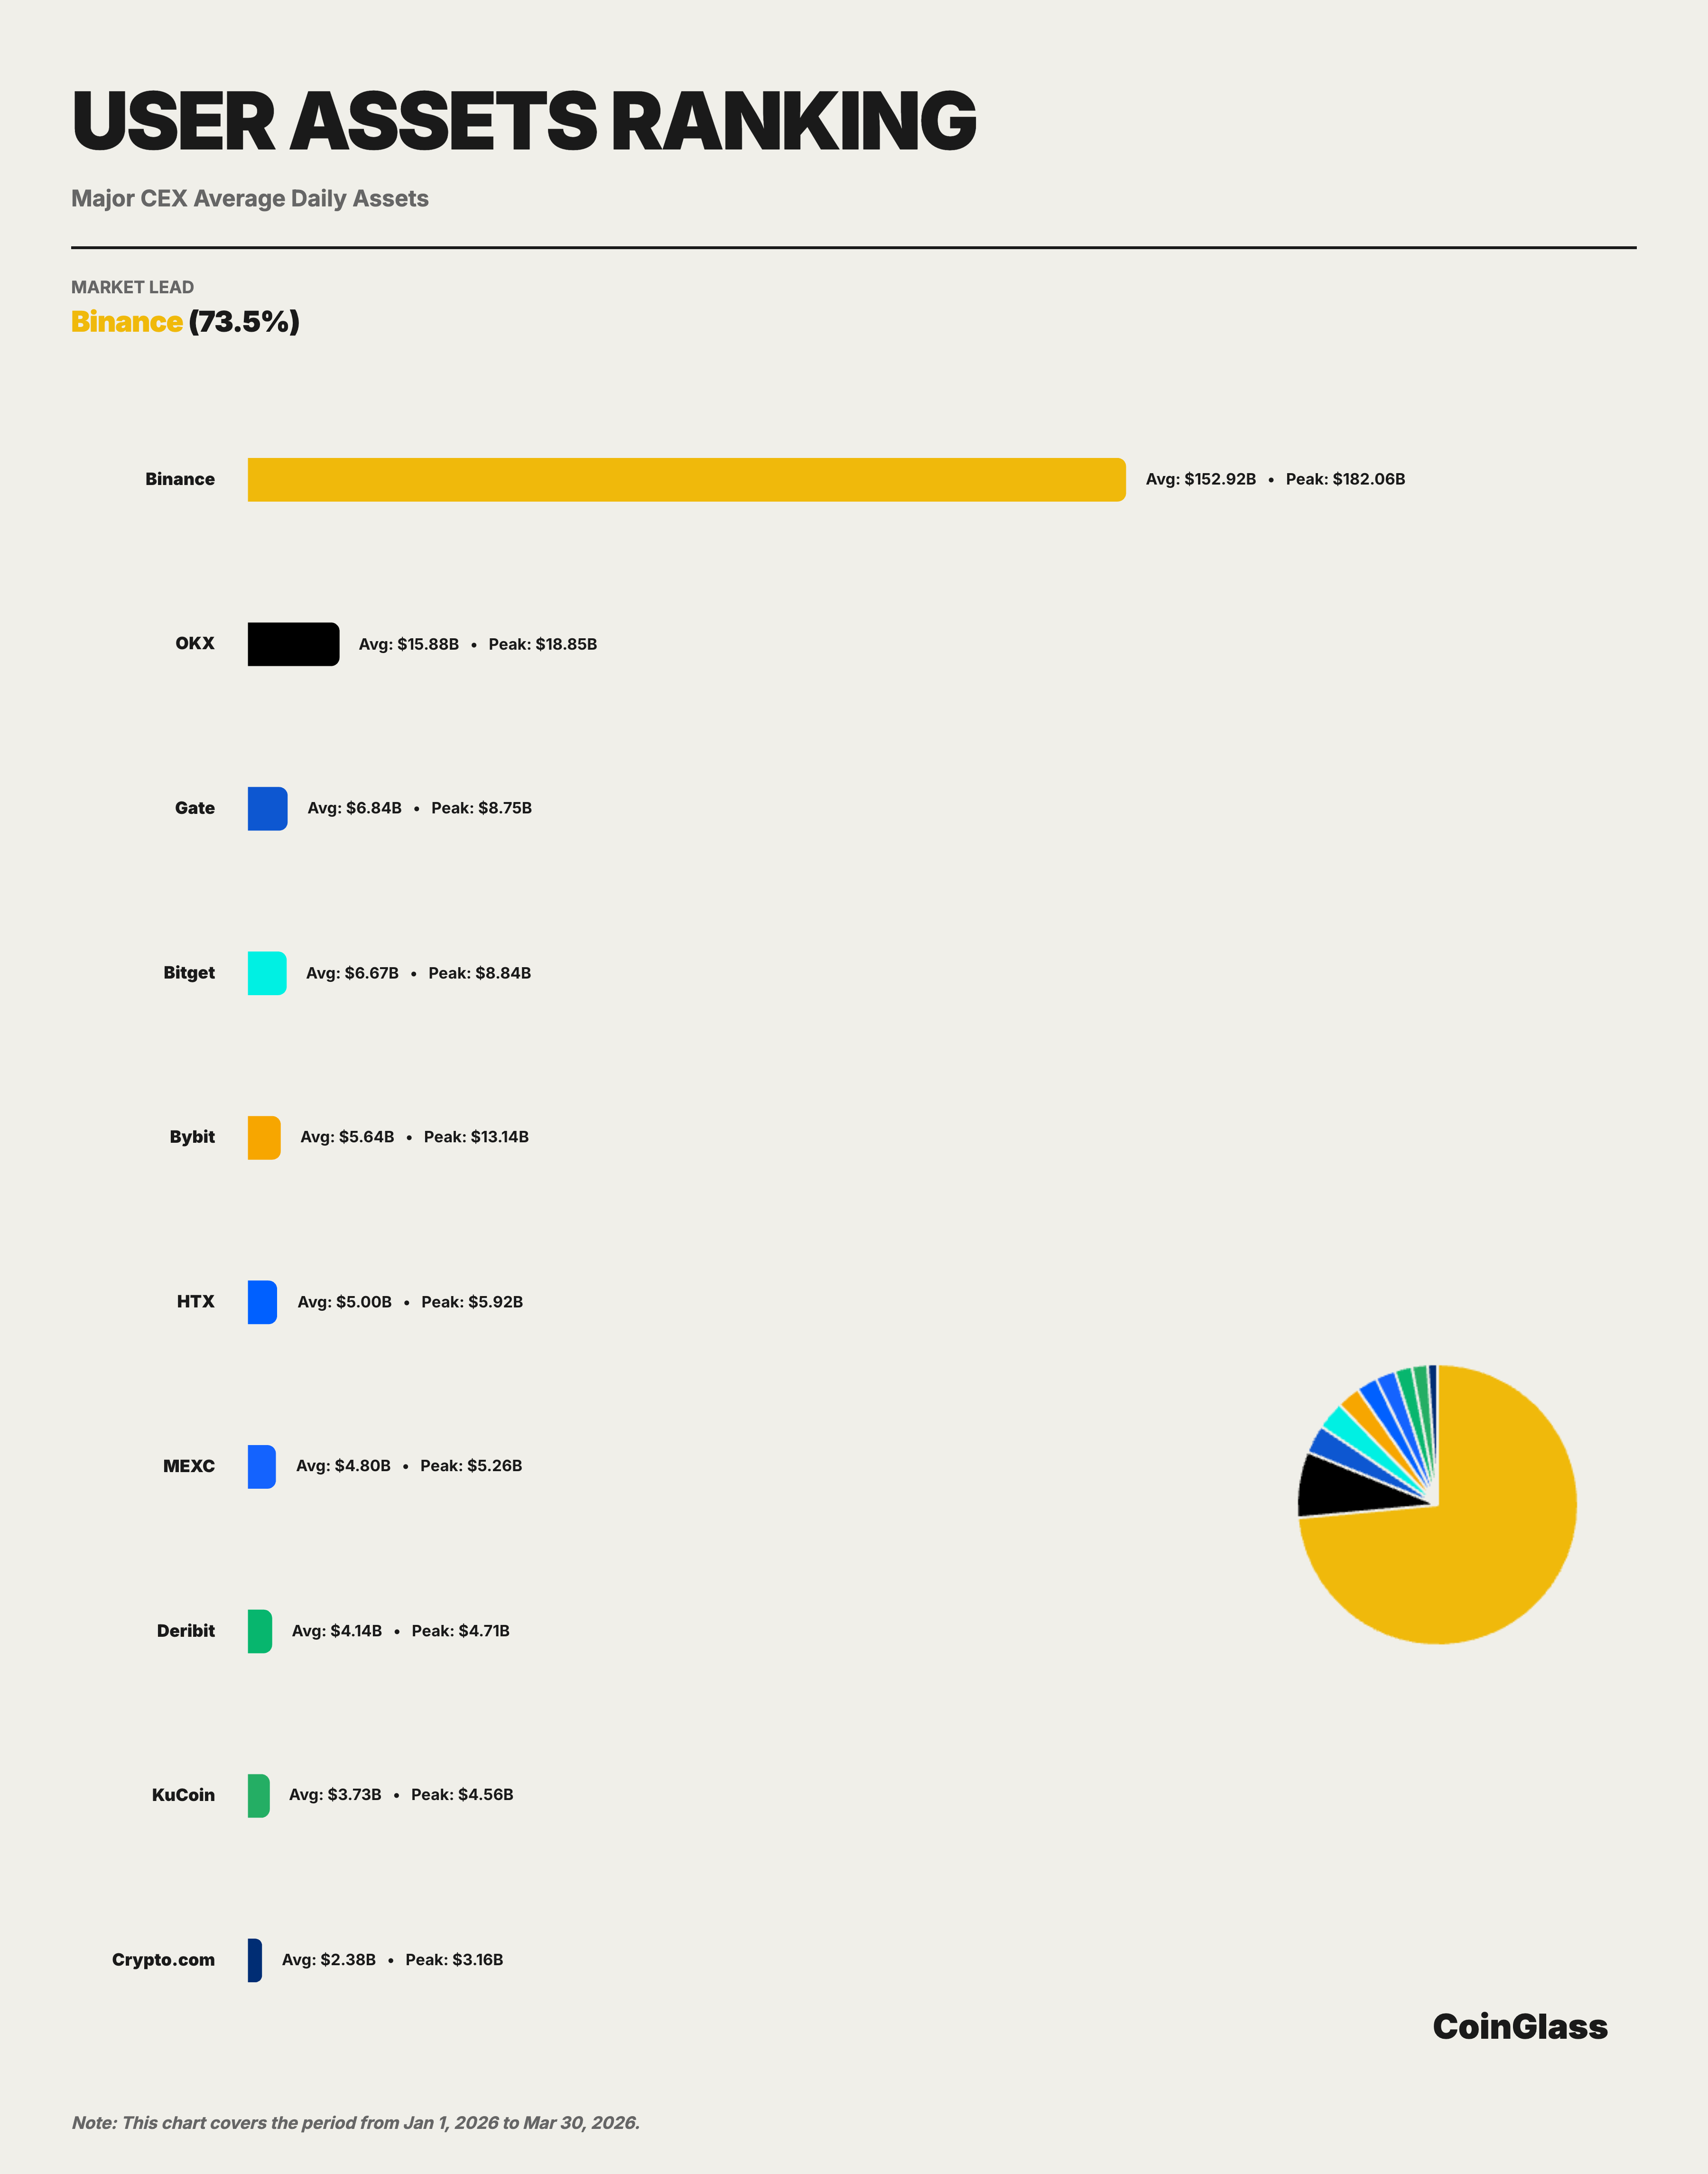
In Q1 2026, Binance’s average daily custodial assets were approximately $152.9 billion, accounting for about 73.5% among the Top 10 exchanges. This proportion far exceeds Binance’s market share in trading volume (about 34.9%) and open interest (about 29.9%), indicating that Binance’s concentration at the custodial level is significantly higher than at the trading activity level.
For exchanges, user asset retention is typically associated with brand trust, product ecosystem, on/off-ramp convenience, and cross-product usage scenarios, making this metric more reflective of a platform’s comprehensive competitive position over the medium to long term.
On a monthly trend basis, Binance’s custodial assets underwent a decline-then-stabilize pattern during Q1. January averaged approximately $172.7 billion (the quarterly high), reflecting capital inflows driven by optimistic market sentiment at the start of the year. February fell to approximately $136.4 billion, a decline of about 21%, consistent with the concurrent OI decline. March saw a slight recovery to approximately $147.8 billion, indicating that capital outflows had largely stabilized. The quarterly peak occurred on January 15 at approximately $182.1 billion.
The Top 5 platforms were Binance, OKX, Gate, Bitget, and Bybit, with corresponding average user assets of approximately $152.9 billion, $15.9 billion, $6.8 billion, $6.7 billion, and $5.6 billion. In other words, among major CEXs, only OKX maintained above $10 billion, while the third through fifth platforms clustered in the $5–7 billion range, presenting an overall pattern of “a significantly leading first place, a distant second, and the rest relatively close.”
5.2 Mainstream CEX Asset Reserve Comparison
Market concentration in the user asset reserves dimension is far higher than in trading volume and open interest.
Among the Top 10 exchanges, Binance leads decisively at $152.9 billion, while second-ranked OKX averages about $15.9 billion daily—only one-tenth of Binance’s. Third through fifth are Gate ($6.8 billion), Bitget ($6.7 billion), and Bybit ($5.6 billion)—three platforms of similar scale but with an order-of-magnitude gap to Binance, whose assets are approximately 8x their combined total. Binance’s average user assets are approximately 9.6x OKX’s, 22.4x Gate’s, 22.9x Bitget’s, and 27.1x Bybit’s.
Compared to its lead in derivatives volume and OI, Binance’s advantage in asset reserves is even more pronounced. This means Binance’s market position is not merely reflected in trading activity but more importantly in the platform preference for long-term capital parking. In industry competition, this type of leadership typically exhibits higher stability and is more difficult to replicate in the short term. This extremely concentrated distribution means that at the user custody level, Binance effectively functions as “systemic infrastructure,” with its operational and compliance status having an amplified effect on the stability of the entire crypto market.
In the second tier, HTX ($5.0 billion), MEXC ($4.8 billion), Deribit ($4.1 billion), KuCoin ($3.7 billion), and Crypto.com ($2.4 billion) form the long tail.
VI. Comprehensive Analysis and Outlook
Synthesizing data across four dimensions—trading volume, open interest, liquidity depth, and user asset reserves—the following core conclusions can be drawn:
First, Binance’s market leadership is comprehensive and robust. Binance ranks first across all core dimensions: derivatives volume of approximately $4.90 trillion (34.9% Top 10 share), average daily OI of $23.9 billion (29.9% share), BTC futures depth of $284 million (54.6% share), and user assets of $152.9 billion (73.5% share). More importantly, Binance’s lead in liquidity depth and asset custody is far greater than in trading volume, meaning its role as core infrastructure of the cryptocurrency market is more entrenched than simple volume rankings would suggest.
Second, the derivatives market competitive landscape is being reshaped. OKX is currently the centralized platform closest to Binance, primarily in derivatives volume and futures depth. Bybit is characterized by relatively balanced performance across volume, OI, and spot liquidity. Gate maintains a strong presence in derivatives volume and OI but has relatively weaker asset retention. Bitget is an important platform in the second tier, maintaining Top 5 positions in both derivatives volume and OI. Meanwhile, the derivatives market traditionally dominated by a few leading CEXs is being simultaneously challenged by two forces: on one end, regulated institutional channels represented by CME, and on the other, decentralized protocols represented by Hyperliquid. The former primarily attracts hedging and basis-trading demand, while the latter draws a segment of high-frequency and strategy traders with its censorship resistance, composability, and 24/7 non-stop operation.
Third, the market is advancing cautiously through recovery. Q1 saw month-over-month volume contraction and OI stabilizing after pulling back from highs, reflecting the characteristics of a recovery period following the extreme events of Q4 2025. Heading into Q2, key variables to watch include: the clarification of the Federal Reserve’s monetary policy path, changes in BTC spot ETF fund flows, and the progress of regulatory framework implementation across major jurisdictions.

