In crypto markets, the ideas of inflow and outflow are widely used to describe which side is dominating. In practice, however, the term is often mixed with other notions: some people mean funds moving into or out of exchanges, others mean net on-chain transfers, and others mean directionality at the trade level. This article uses a precise and reproducible definition: inflow/outflow equals net active buy volume minus active sell volume. A positive value indicates net inflow, and a negative value indicates net outflow. Active here refers to taker behavior, meaning trades executed immediately by crossing the order book, as opposed to passive maker orders resting on the book. Because this measure is built from trade direction, it reflects traders’ immediate actions and short-horizon intent.
Active trading and the meaning of net inflow/outflow
An order-book market always contains bids and asks. If a trade executes on the ask side, the buyer has consumed existing sell orders, so that trade is classified as an active buy. If a trade executes on the bid side, the seller has consumed existing buy orders, so that trade is classified as an active sell. Aggregating trades by direction over a time window yields active buy volume and active sell volume; their difference is net inflow. Conceptually, this metric measures net active demand rather than where capital comes from or where it goes. It describes which side is more willing to trade immediately and thereby drive the matching process.
Inflow/outflow in spot markets
Spot markets involve trading the underlying asset itself, for example exchanging USDT for BTC and holding BTC as the result. Under the definition used here, spot net inflow means that, within the chosen window, active buy volume exceeds active sell volume, typically implying stronger immediate buying pressure. For instance, if within one minute the BTC/USDT market records 120 BTC of active buys and 80 BTC of active sells, net inflow equals +40 BTC, indicating that buyers were more aggressive in consuming liquidity. Importantly, spot net inflow does not mean new money entered from outside the market; it only says that, at the transaction level, buyers were the more active side. Whether price rises depends additionally on order-book depth and on how readily sellers supply liquidity at higher prices.
Inflow/outflow in derivatives markets
Derivatives markets are dominated by perpetual swaps and dated futures. These products also trade on order books and therefore support the same classification by taker direction, so the computation of net inflow is unchanged. The interpretation, however, leans more toward leveraged risk appetite and the speed of position adjustments. In derivatives, active buys can be driven by opening longs, closing shorts, or two-sided position transfers where the buyer is the taker; active sells can be driven by opening shorts, closing longs, or similar transfers where the seller is the taker. As a result, a positive net inflow in derivatives does not automatically mean net long exposure is increasing. It first indicates stronger immediate buy-side aggressiveness. To distinguish opening-driven moves from closing-driven moves, analysts typically pair net inflow with open interest, funding rates, and liquidation data.
Computation and data sources
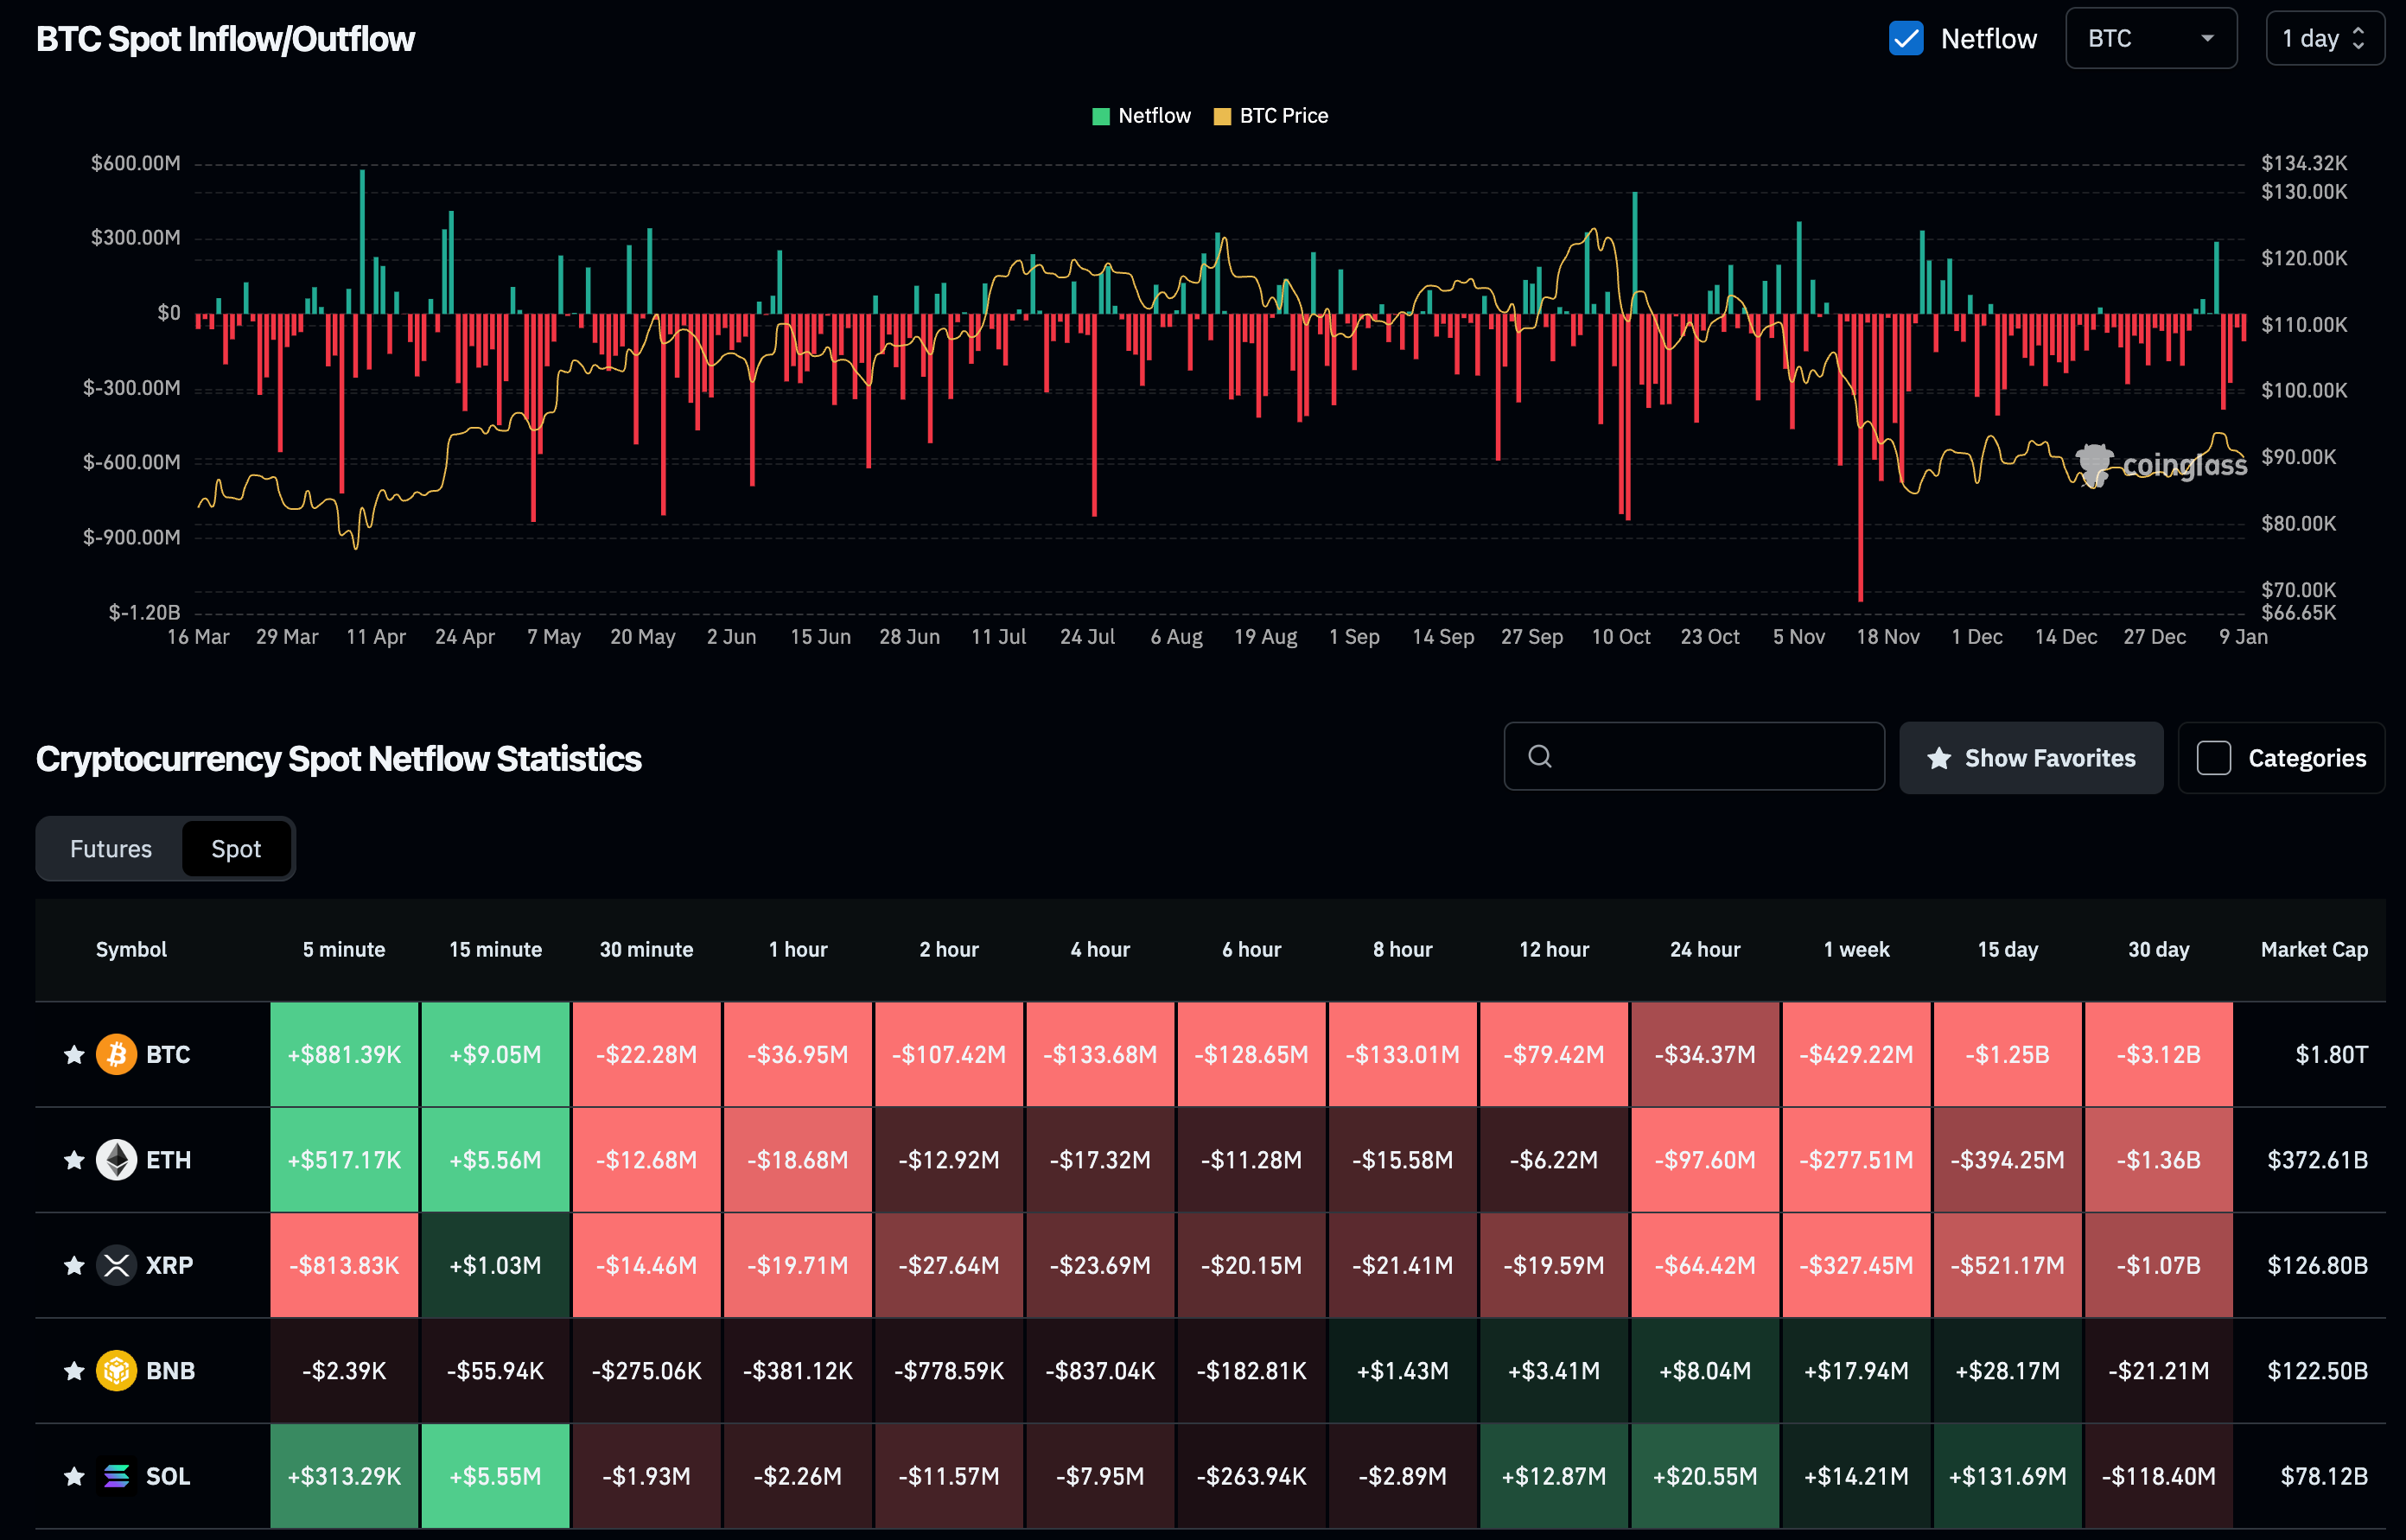
Net inflow can be expressed as a simple difference. Over time window T, classify trades by direction and sum them to obtain active buy volume B(T) and active sell volume S(T). Net inflow is then N(T)=B(T)−S(T). The key operational step is trade classification. Most major exchanges and data services provide statistics such as taker buy volume and taker sell volume. When only raw tick data are available, direction can be inferred by comparing trade prices to contemporaneous best bid/ask quotes, though this approximation can introduce errors under fast price moves and microstructure noise. In terms of data sources, exchanges typically offer market-data APIs or historical data services that include trade and direction-related fields; Binance, for example, provides comprehensive endpoints for market data that allow researchers to construct custom windowed inflow series. Aggregators standardize and combine multi-venue data; CoinGlass is widely used on the derivatives side for consolidated views of volume, open interest, funding rates, and liquidations. Even so, users should verify the aggregator’s unit conventions and aggregation rules before comparing across venues or instruments.
Common pitfalls and validation checks
A first pitfall is equating positive net inflow with price appreciation. Positive net inflow only indicates more aggressive buying; it does not guarantee an up move. In deep order books, large net inflow can be absorbed with only modest price changes, while in thin conditions even small net inflow can move price sharply. A second pitfall is treating derivatives net inflow as a proxy for position growth. Positive net inflow can reflect either new long opening or short covering. A practical way to distinguish these mechanisms is to look jointly at open interest: if net inflow turns positive while open interest rises, the move is more consistent with opening-driven expansion; if net inflow turns positive while open interest falls, the move is more consistent with covering and deleveraging. A third pitfall concerns comparability. Different venues and contracts use different multipliers and units, so the same numeric value can mean different economic size. Cross-market analysis should standardize to a common scale such as notional value or base-asset units, and ensure consistent time alignment and outlier handling.
Analytical value and typical applications
The main value of net inflow is that it extracts directional pressure from total activity. Total volume measures intensity, but it cannot tell whether intensity comes from aggressive buyers or aggressive sellers; net inflow provides that direction. In spot markets, persistent positive net inflow often indicates buyers are willing to pay up and take liquidity, and when it coincides with rising volume and a break of a key price level, it can strengthen trend-based interpretations. In derivatives, net inflow functions as a more immediate read on leveraged sentiment. When net inflow stays positive while funding rates rise and open interest expands, long-side crowding risk increases: the trend may continue, but the market also becomes more vulnerable to reversals and squeeze dynamics. When net inflow flips negative alongside elevated liquidations, it can signal accelerating deleveraging and higher reversal risk. In practice, analysts rarely rely on net inflow alone; they integrate it with open interest, funding, basis, volatility, liquidation flow, and measures of liquidity.
Case example: two different stories behind positive net inflow
Consider two episodes of positive net inflow in BTC on the same day. In the first episode, price breaks above a key resistance level and both spot and derivatives show sustained positive net inflow. Open interest climbs steadily, funding rises moderately, and liquidations remain limited. This configuration is more consistent with an incremental, opening-driven trend extension, because directional aggressiveness and position expansion move together. In the second episode, price rebounds sharply after a decline and derivatives net inflow turns strongly positive, yet open interest drops noticeably. At the same time, short liquidations increase and funding retreats quickly. This configuration is more consistent with short covering and liquidation-driven rebound: buying is aggressive, but total leveraged exposure is shrinking, indicating deleveraging rather than fresh risk addition. The two episodes share the same sign of net inflow, but their mechanisms differ, which is why joint validation with open interest and liquidation dynamics is essential.
Conclusion
Defined as active buy volume minus active sell volume, inflow/outflow is fundamentally a measure of net active demand. It captures the direction of immediate trading pressure created by takers. Spot net inflow is closer to directional demand for the underlying asset, while derivatives net inflow is more sensitive to leveraged sentiment and position adjustment. The metric can be constructed from exchange market-data APIs and cross-checked using consolidated datasets from platforms such as CoinGlass and Binance. Used together with open interest, funding, liquidity depth, and liquidation data, net inflow becomes a more interpretable tool that helps distinguish opening-driven trends from covering-driven squeezes and rebounds.

