I. Executive Summary
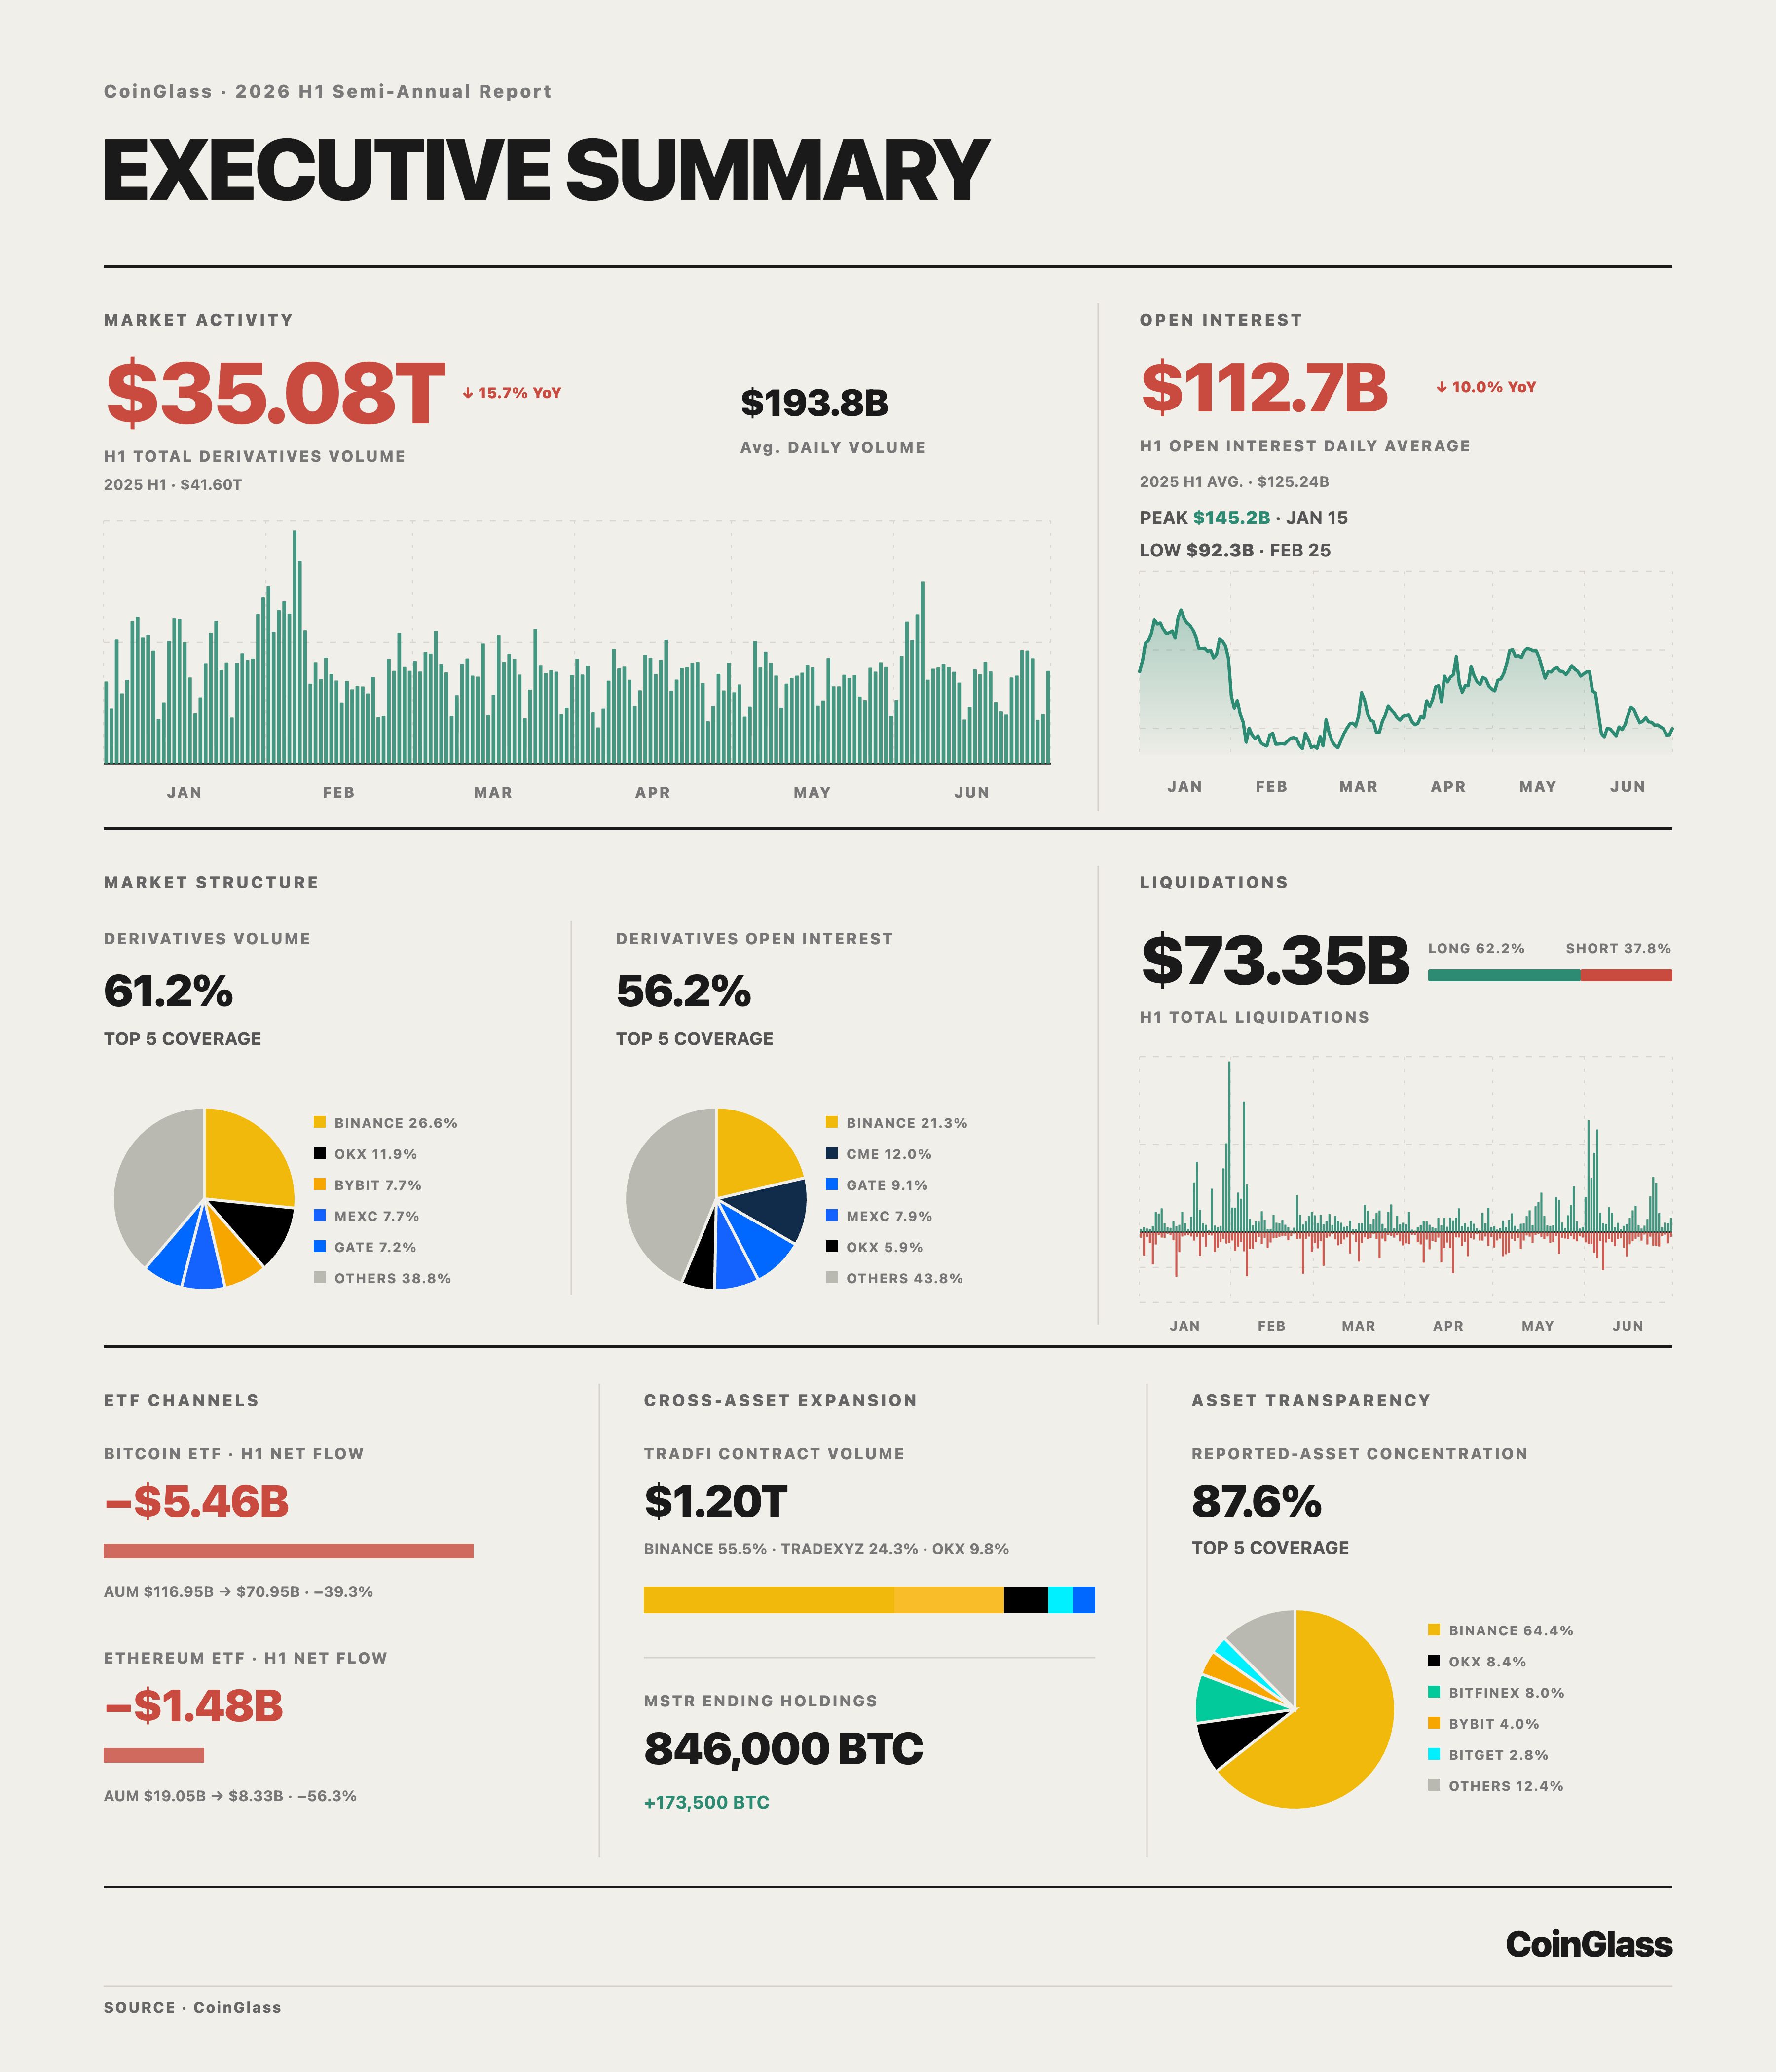
In H1 2026, the cryptocurrency derivatives market was characterized by lower trading activity, still-elevated outstanding risk exposure, and concentrated liquidation pressure. During the period, total market-wide derivatives volume was US$35.08 trillion, averaging US$193.8 billion per day, down 15.7% from US$41.60 trillion in the same period of 2025. The decline in volume primarily indicates that contract turnover, short-term participation, and risk appetite were weaker than a year earlier, rather than a commensurate reduction in all risk borne by the market. Monthly volume declined progressively from US$6.73 trillion in January to US$5.29 trillion in April, before recovering to US$5.66 trillion in June.
The contraction in open interest (OI) was markedly smaller than the decline in volume. Average daily OI was US$112.7 billion in H1, down 10.0% year over year; average daily OI rose 2.1% in Q2 from Q1, while total volume declined 13.5% over the same period. This divergence indicates that many positions did not exit in tandem with the cooling in trading activity, leaving substantial exposure in the market. Nevertheless, OI stood at US$99.9 billion on June 30, down 17.9% from the start of the year.
Liquidation data further show that risk unwinding was highly concentrated in time. Sample exchanges recorded US$73.35 billion in total liquidations in H1, comprising US$45.63 billion in long liquidations, or 62.2%, and US$27.72 billion in short liquidations, or 37.8%. The largest single-day liquidation event occurred on January 31, totaling US$2.588 billion. June recorded the highest monthly liquidation total at US$16.14 billion, with the share of long liquidations rising to 69.5%. The contraction in trading volume did not eliminate leveraged positions' sensitivity to rapid price changes; market stress was more likely to be transmitted through concentrated deleveraging events during a small number of windows.
The exchange landscape remained highly concentrated at the top, although different metrics reflected different forms of market leadership. The Top 5 and Top 10 exchanges accounted for 61.2% and 81.2% of total volume, respectively, while the corresponding coverage ratios for average daily OI were 56.2% and 79.3%. CME's share of average daily OI reached 12.0%, well above its 4.1% share of volume, indicating that institutional, longer-dated, or lower-turnover positions played an important role in the market structure; meanwhile, trading activity remained concentrated primarily on crypto-native platforms.
Strategy (ticker: MSTR) increased its net BTC holdings by 173,500 in H1, but two sales broke the market's expectation that it would "only buy, never sell": after the first sale of 32 BTC, MSTR fell approximately 6% that day and BTC slipped below US$71,500; the company sold another 1,363 BTC in late June and continued selling in early July. Other market factors also affected the related price moves, but the sales clearly amplified investor concerns about financing pressure and future supply. The market impact of Strategy's BTC sales warrants continued assessment.
Trading activity began to stabilize after April and recovered somewhat in June, but trading breadth, period-end OI, and institutional flows did not improve in tandem. More data are needed to confirm the durability of the market recovery.
II. Derivatives Market Overview
II.I Market-Wide Derivatives Volume
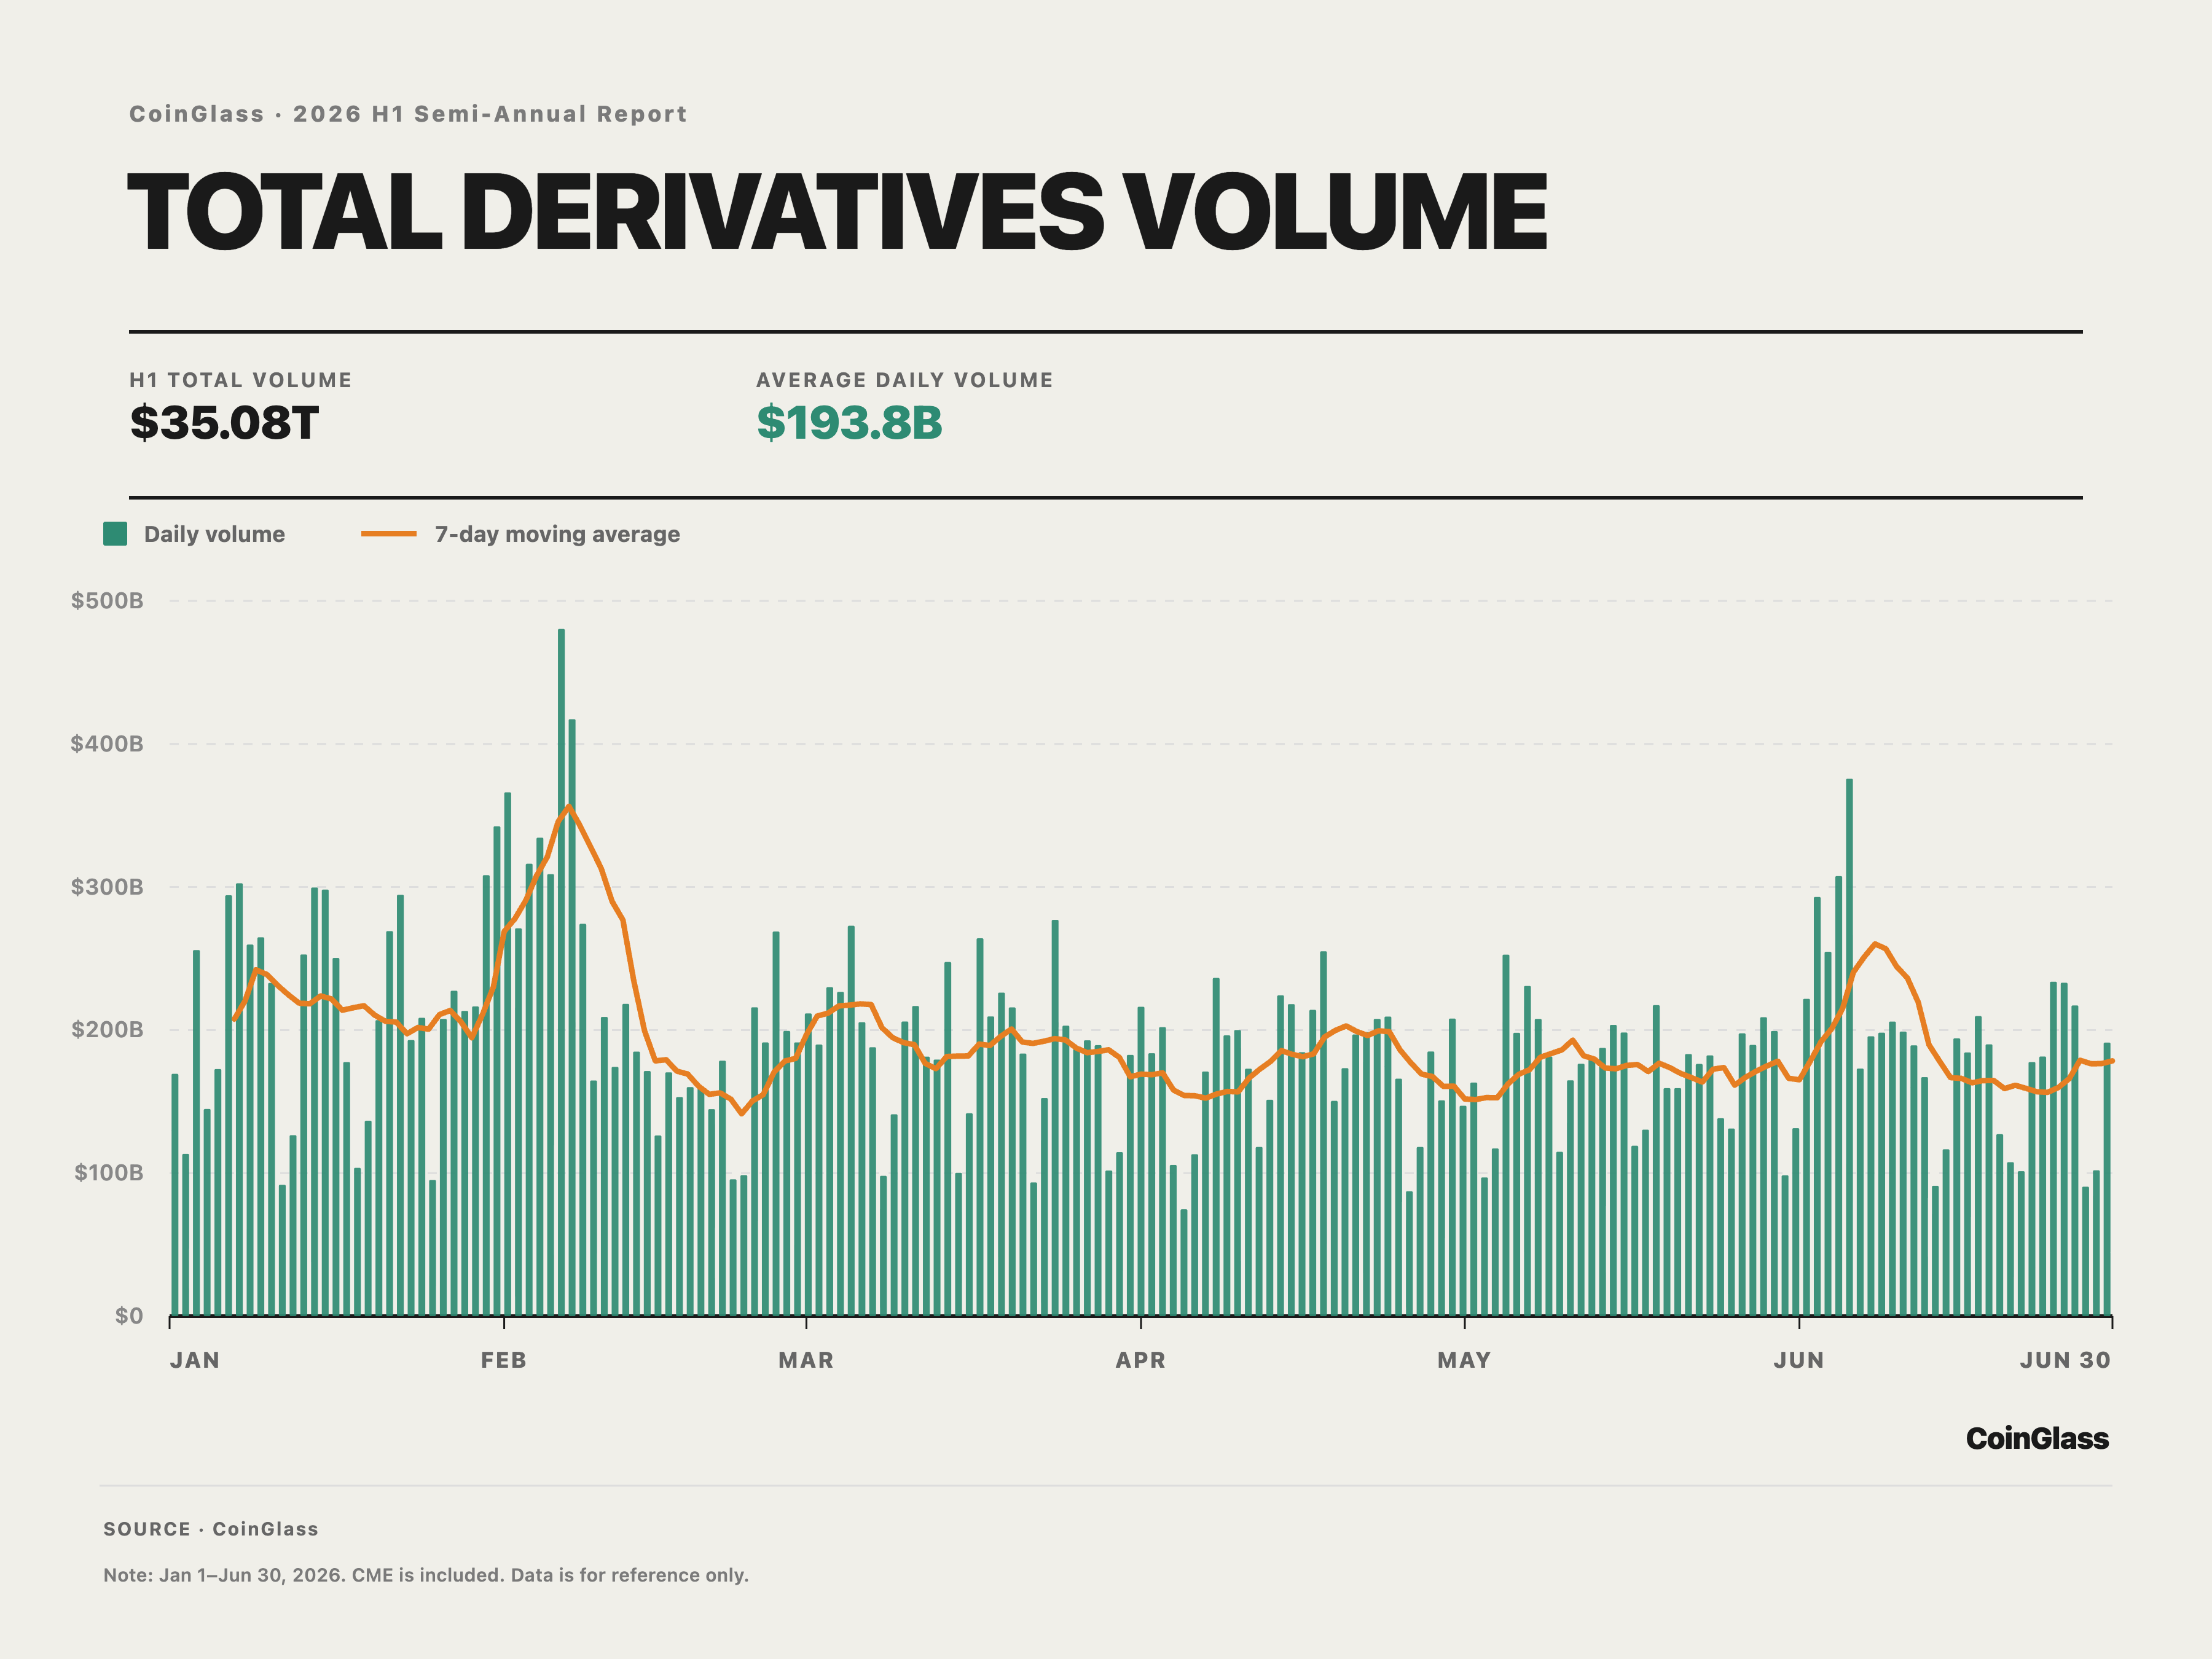
The defining H1 volume trend was a pullback from elevated levels followed by a limited recovery. Cumulative volume totaled US$35.08 trillion, or US$193.8 billion per day; on the same basis, volume was US$41.60 trillion in the same period of 2025, representing a 15.7% year-over-year decline. This gap indicates that, compared with a year earlier, contract turnover and short-term trading demand weakened overall. The sustained contraction in volume indicates that the market as a whole became more cautious about adding new risk exposure; a recovery in volume will require clearer volatility opportunities and return expectations.
The monthly trajectory shows that the cooling was not a one-day anomaly. Volume was US$6.73 trillion in January, fell to US$6.25 trillion in February and US$5.83 trillion in March, reached an interim low of US$5.29 trillion in April, was broadly flat at US$5.31 trillion in May, and recovered to US$5.66 trillion in June. On this basis, Q1 volume was US$18.81 trillion and Q2 volume was US$16.27 trillion, a quarter-over-quarter decline of 13.5%. June volume increased 6.5% from May, indicating some recovery in trading demand after the weakest phase; however, June volume remained 15.9% below January, insufficient to reverse the overall contraction in H1.
Daily volume displayed a pronounced event-driven pattern. Market-wide volume rose to US$480.4 billion on February 6, the H1 peak, and fell to US$74.7 billion on April 5, implying a peak-to-trough ratio of approximately 6.4 times. The high dispersion in daily volume indicates that market capital was concentrated in a small number of high-volatility windows, while participation and liquidity demand were relatively limited during normal trading periods. A monthly rebound driven by only a few exceptionally active trading days is not yet sufficient to confirm a broad and sustained recovery in trading demand.
II.II Derivatives Contract Open Interest
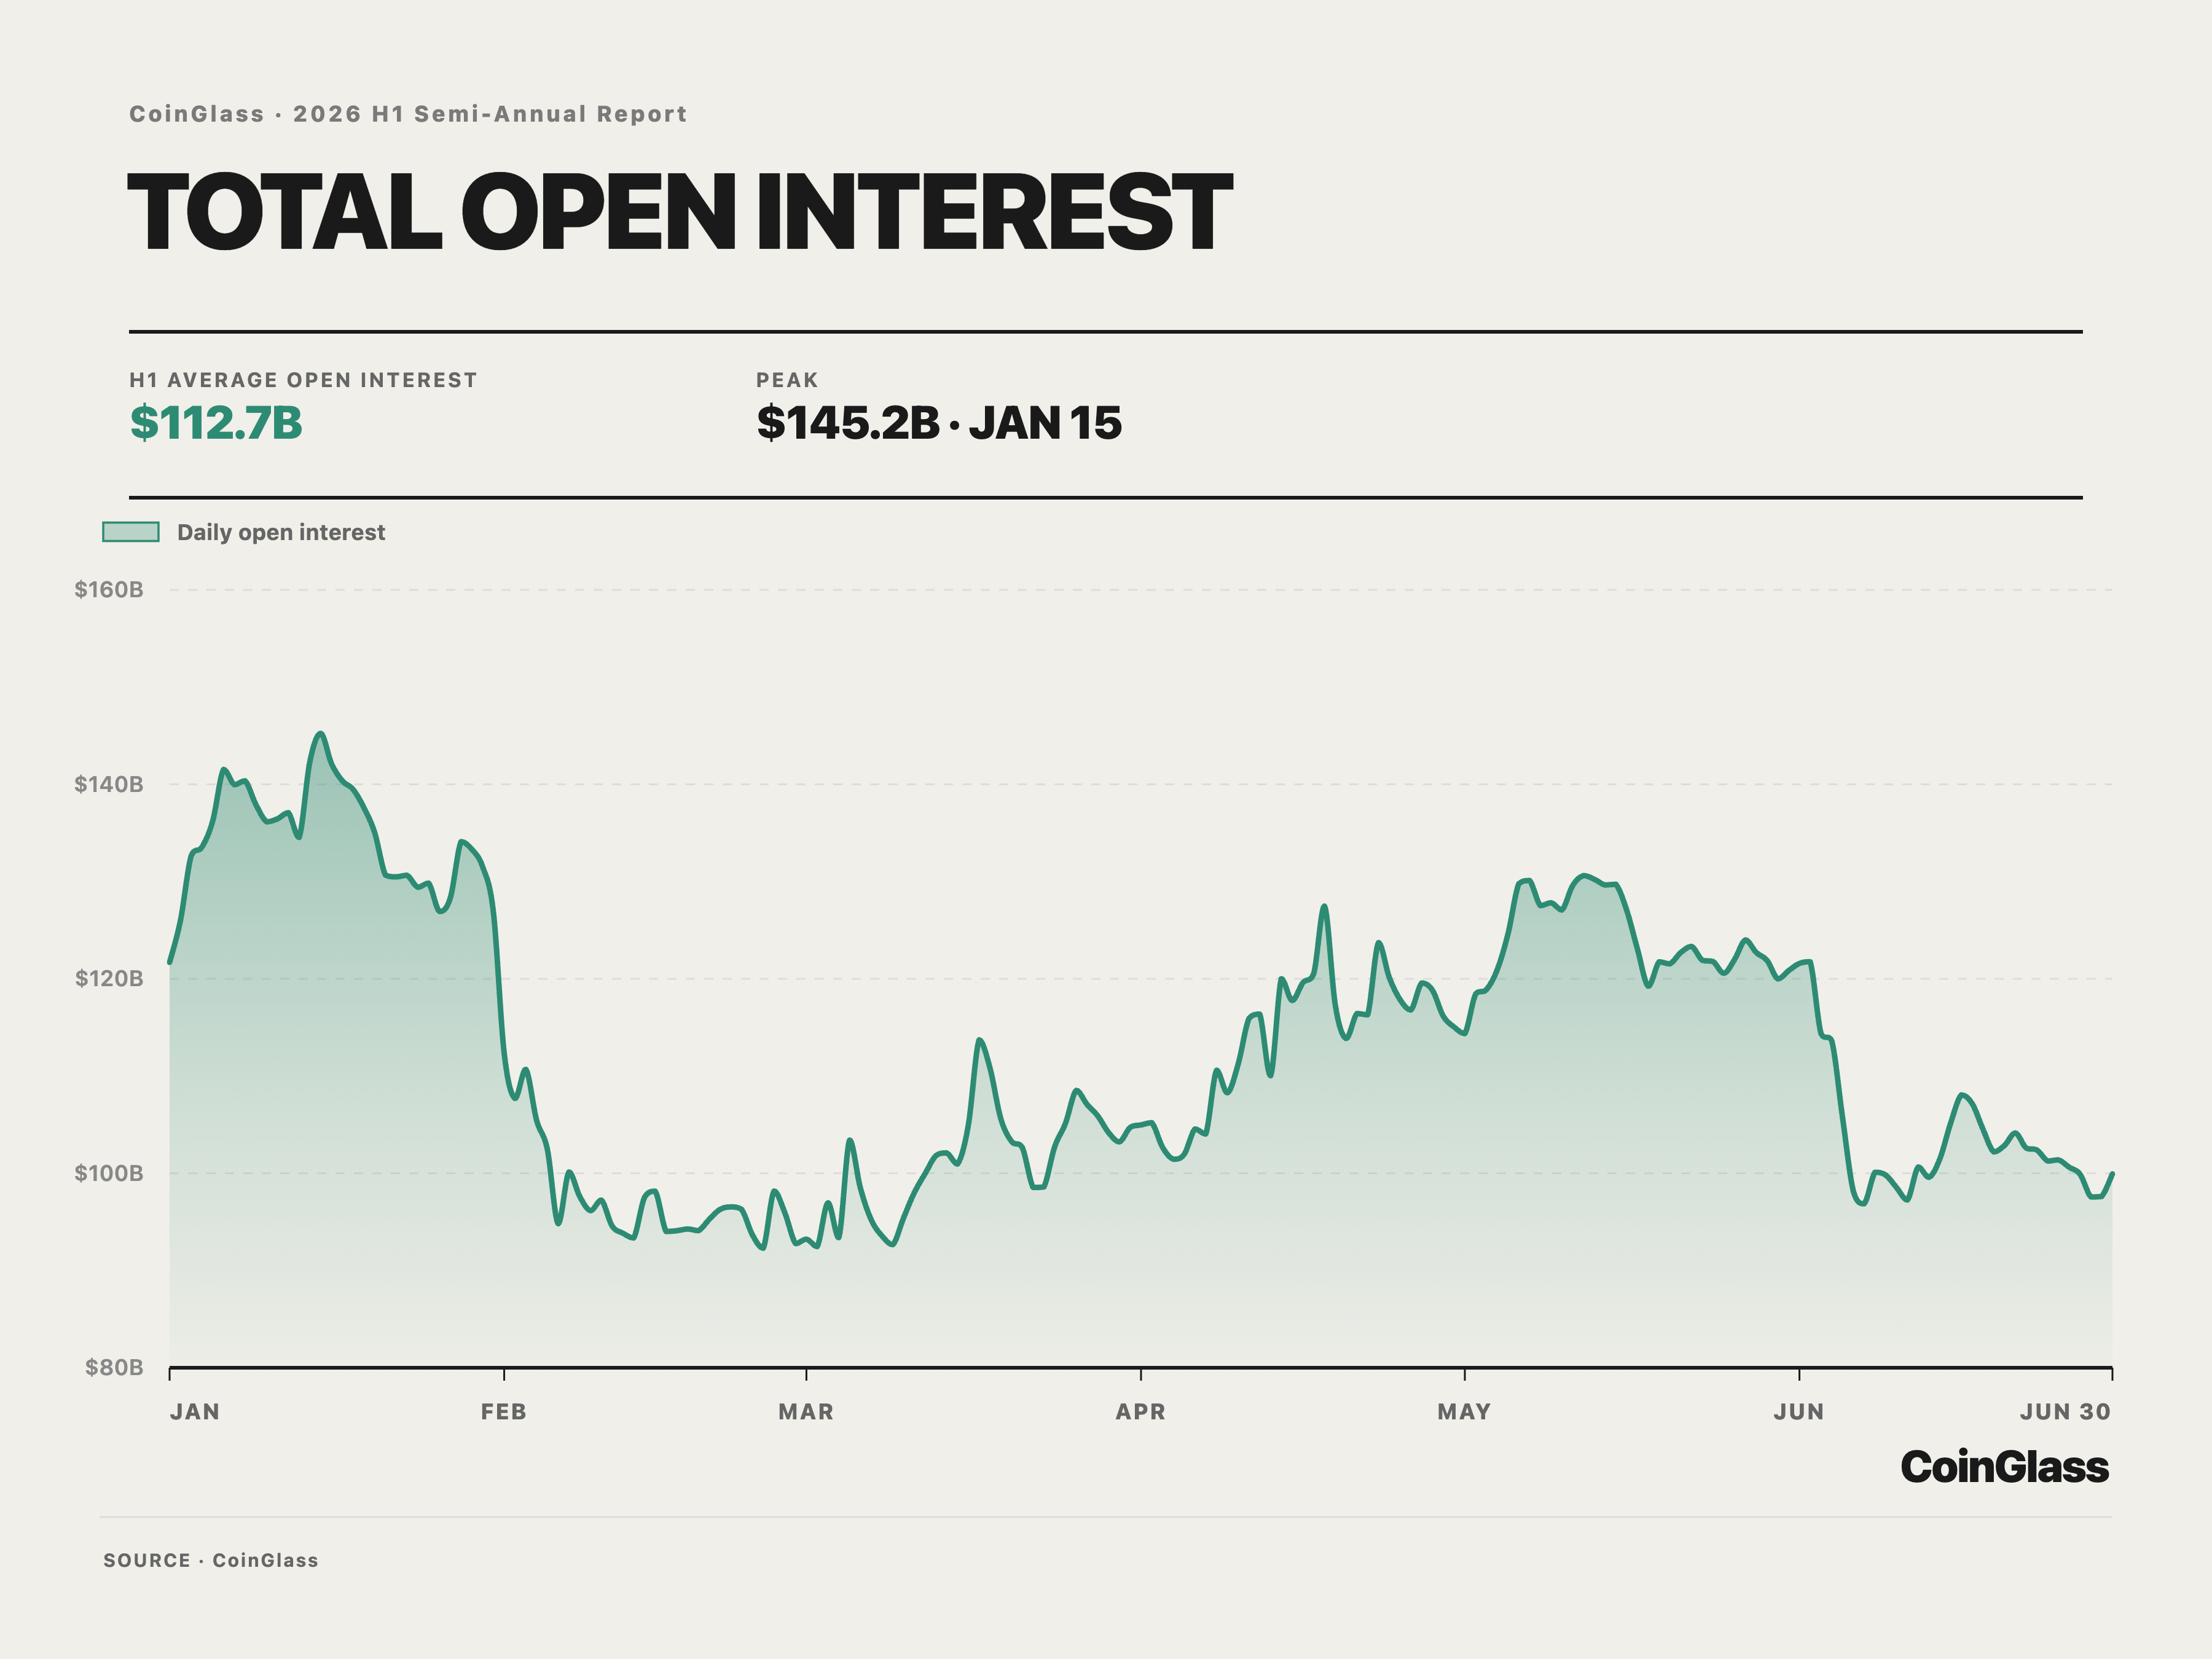
Average daily OI was US$112.7 billion in H1 2026, down 10.0% year over year, a smaller decline than the 15.7% contraction in volume. The position turnover ratio, measured as the ratio of average daily volume to average daily OI, fell approximately 6.3% year over year, indicating less trading activity per unit of outstanding positions and a slower contraction in risk exposure than in market trading activity. If trading activity remains subdued, the efficiency of position reallocation may deteriorate and increase the market's sensitivity to concentrated liquidations during short-term volatility windows.
Average daily OI was US$134.46 billion in January and fell to US$97.70 billion in February, a month-over-month decline of 27.3%. It recovered modestly to US$101.20 billion in March and further to US$113.82 billion and US$123.99 billion in April and May, respectively, before retreating again to US$103.56 billion in June. Daily data followed the same trajectory: OI fell from a peak of US$145.24 billion on January 15 to a low of US$92.29 billion on February 25, a contraction of 36.5% over six weeks, followed by a moderate recovery.
As of June 30, market-wide OI had fallen to US$99.94 billion, down 17.9% from the start of the year, indicating that the recovery in April and May did not persist through period-end. In H2, a simultaneous recovery in OI and volume could signal a joint improvement in risk appetite and liquidity absorption capacity; if OI expands alone while volume and depth remain weak, risk exposure would increasingly accumulate in a low-liquidity environment, potentially increasing the market's sensitivity to price shocks and concentrated liquidations.
II.III Long and Short Liquidations
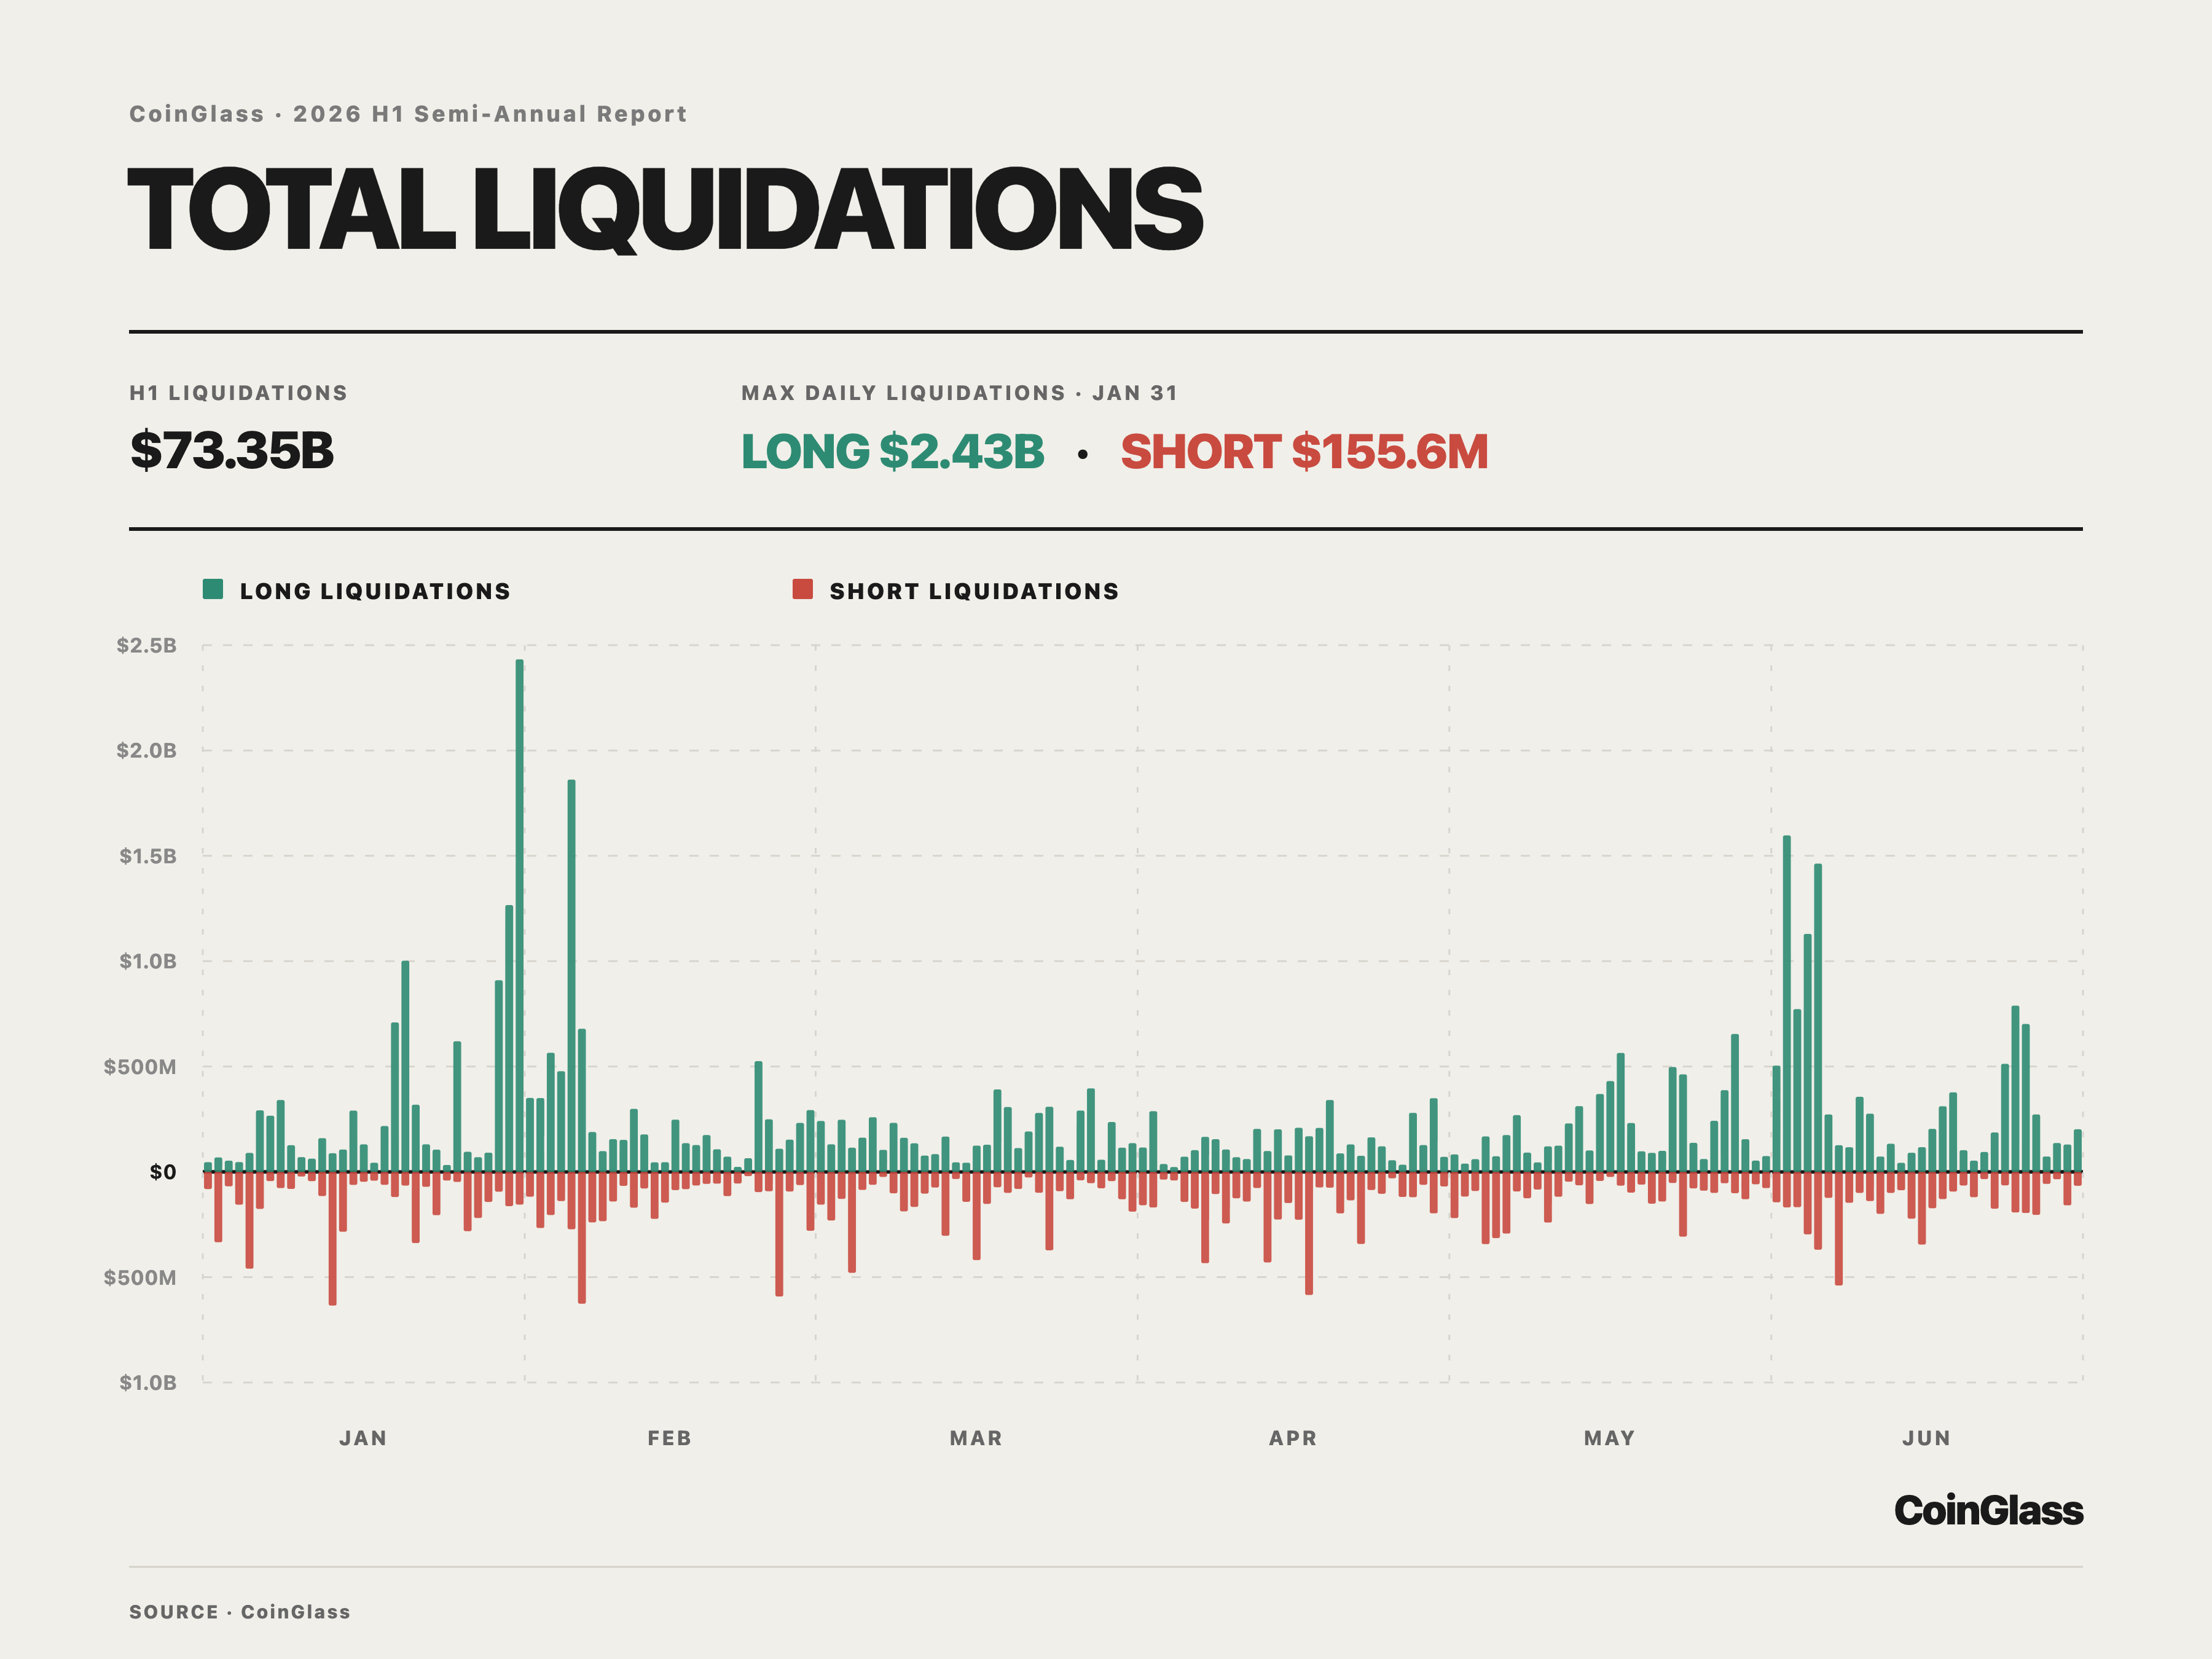
Notional liquidations totaled US$73.35 billion in H1, averaging approximately US$405 million per day. Long liquidations amounted to US$45.63 billion, or 62.2%, while short liquidations totaled US$27.72 billion, or 37.8%. The liquidation profile was clearly skewed toward longs, indicating that leverage reduction was concentrated primarily in downside price windows and that risk unwinding had a strong directional bias.
Monthly liquidations declined before rebounding. From January through June, liquidation totals were US$15.02 billion, US$12.65 billion, US$9.82 billion, US$9.28 billion, US$10.44 billion, and US$16.14 billion, respectively. After reaching an interim low in April, liquidations rose for two consecutive months and reached an H1 high in June, when the long-liquidation share increased to 69.5%. Volume recovered only moderately over the same period, indicating that liquidation intensity was driven primarily by position structure and volatility shocks rather than moving in tandem with market turnover.
Liquidation risk was highly concentrated on a small number of trading days. Liquidations totaled US$2.588 billion on January 31, including US$2.433 billion in long liquidations, making it the largest single-day event in H1. February 5 and June 5 recorded US$2.135 billion and US$1.833 billion, respectively. Together, the three peak days accounted for 8.9% of H1 liquidations, underscoring the strongly event-driven nature of the deleveraging process.
June OI was lower than in May, while monthly liquidations and the long-liquidation share both rose to elevated levels, indicating a greater concentration of downside position adjustments. Outstanding risk exposure remained highly sensitive to changes in volatility and liquidity.
III. Exchange Market Structure
III.I Derivatives Exchange Volume
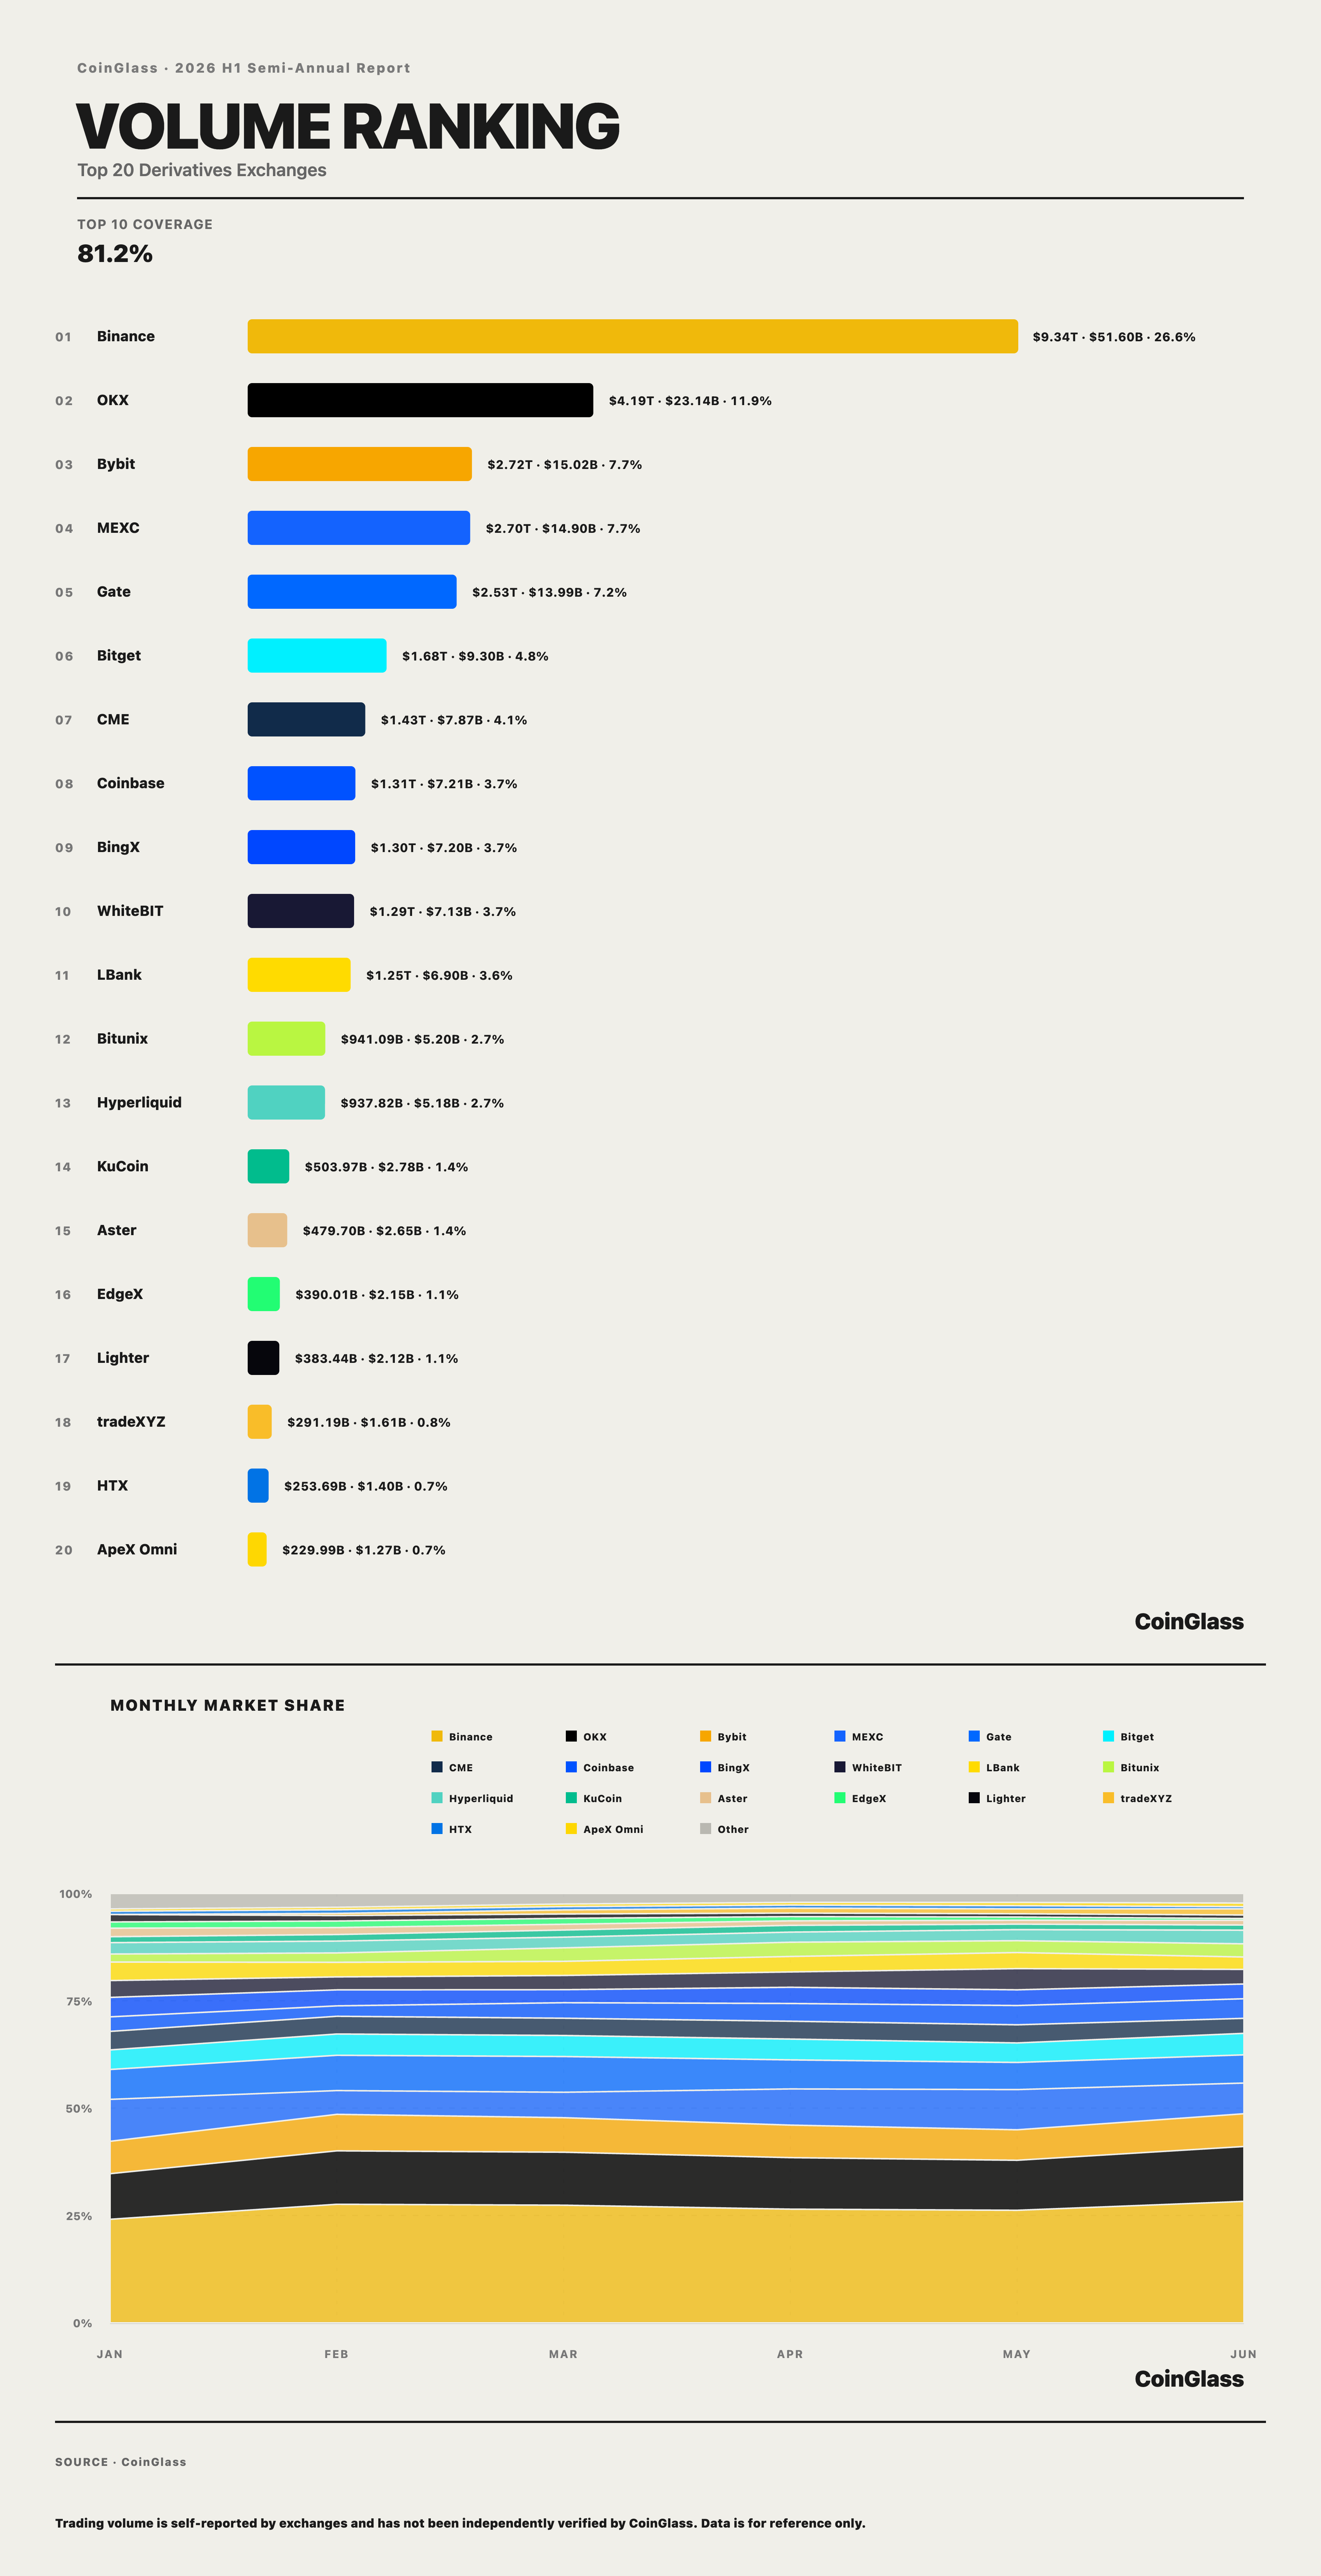
Derivatives volume was highly concentrated among the leading exchanges in H1. The Top 10 accounted for 81.2% of total market volume, while the Top 5 accounted for 61.2%. Binance ranked first with US$9.34 trillion in volume and a 26.6% share, followed by OKX with US$4.19 trillion and an 11.9% share; together, the two accounted for 38.6%. Bybit, MEXC, and Gate recorded US$2.72 trillion, US$2.70 trillion, and US$2.53 trillion, representing 7.7%, 7.7%, and 7.2%, and ranked third through fifth, respectively.
Bitget ranked sixth with US$1.68 trillion and a 4.8% share, while CME ranked seventh with US$1.43 trillion and a 4.1% share. The eighth- through tenth-ranked exchanges were similar in scale: Coinbase, BingX, and WhiteBIT each recorded between US$1.29 trillion and US$1.31 trillion in volume, with shares of approximately 3.7%. The largest difference in volume among the three was approximately US$0.02 trillion, making their rankings sensitive to monthly shifts in order flow. LBank ranked eleventh with US$1.25 trillion and a 3.6% share. Exchanges outside the Top 10 accounted for a combined 18.8%.
Using the fixed Top 10 cohort determined by cumulative H1 volume, the group's combined monthly share rose from 79.7% in January to 82.3% in June. Binance's share increased from 24.1% to 28.3%, and OKX's from 10.6% to 12.8%; over the same period, MEXC's share fell from 9.8% to 7.2%, and CME's from 4.3% to 3.5%. The recovery in June volume was driven primarily by leading crypto-native platforms such as Binance and OKX, pushing market concentration above its level at the start of the year.
III.II Average Daily OI by Derivatives Exchange
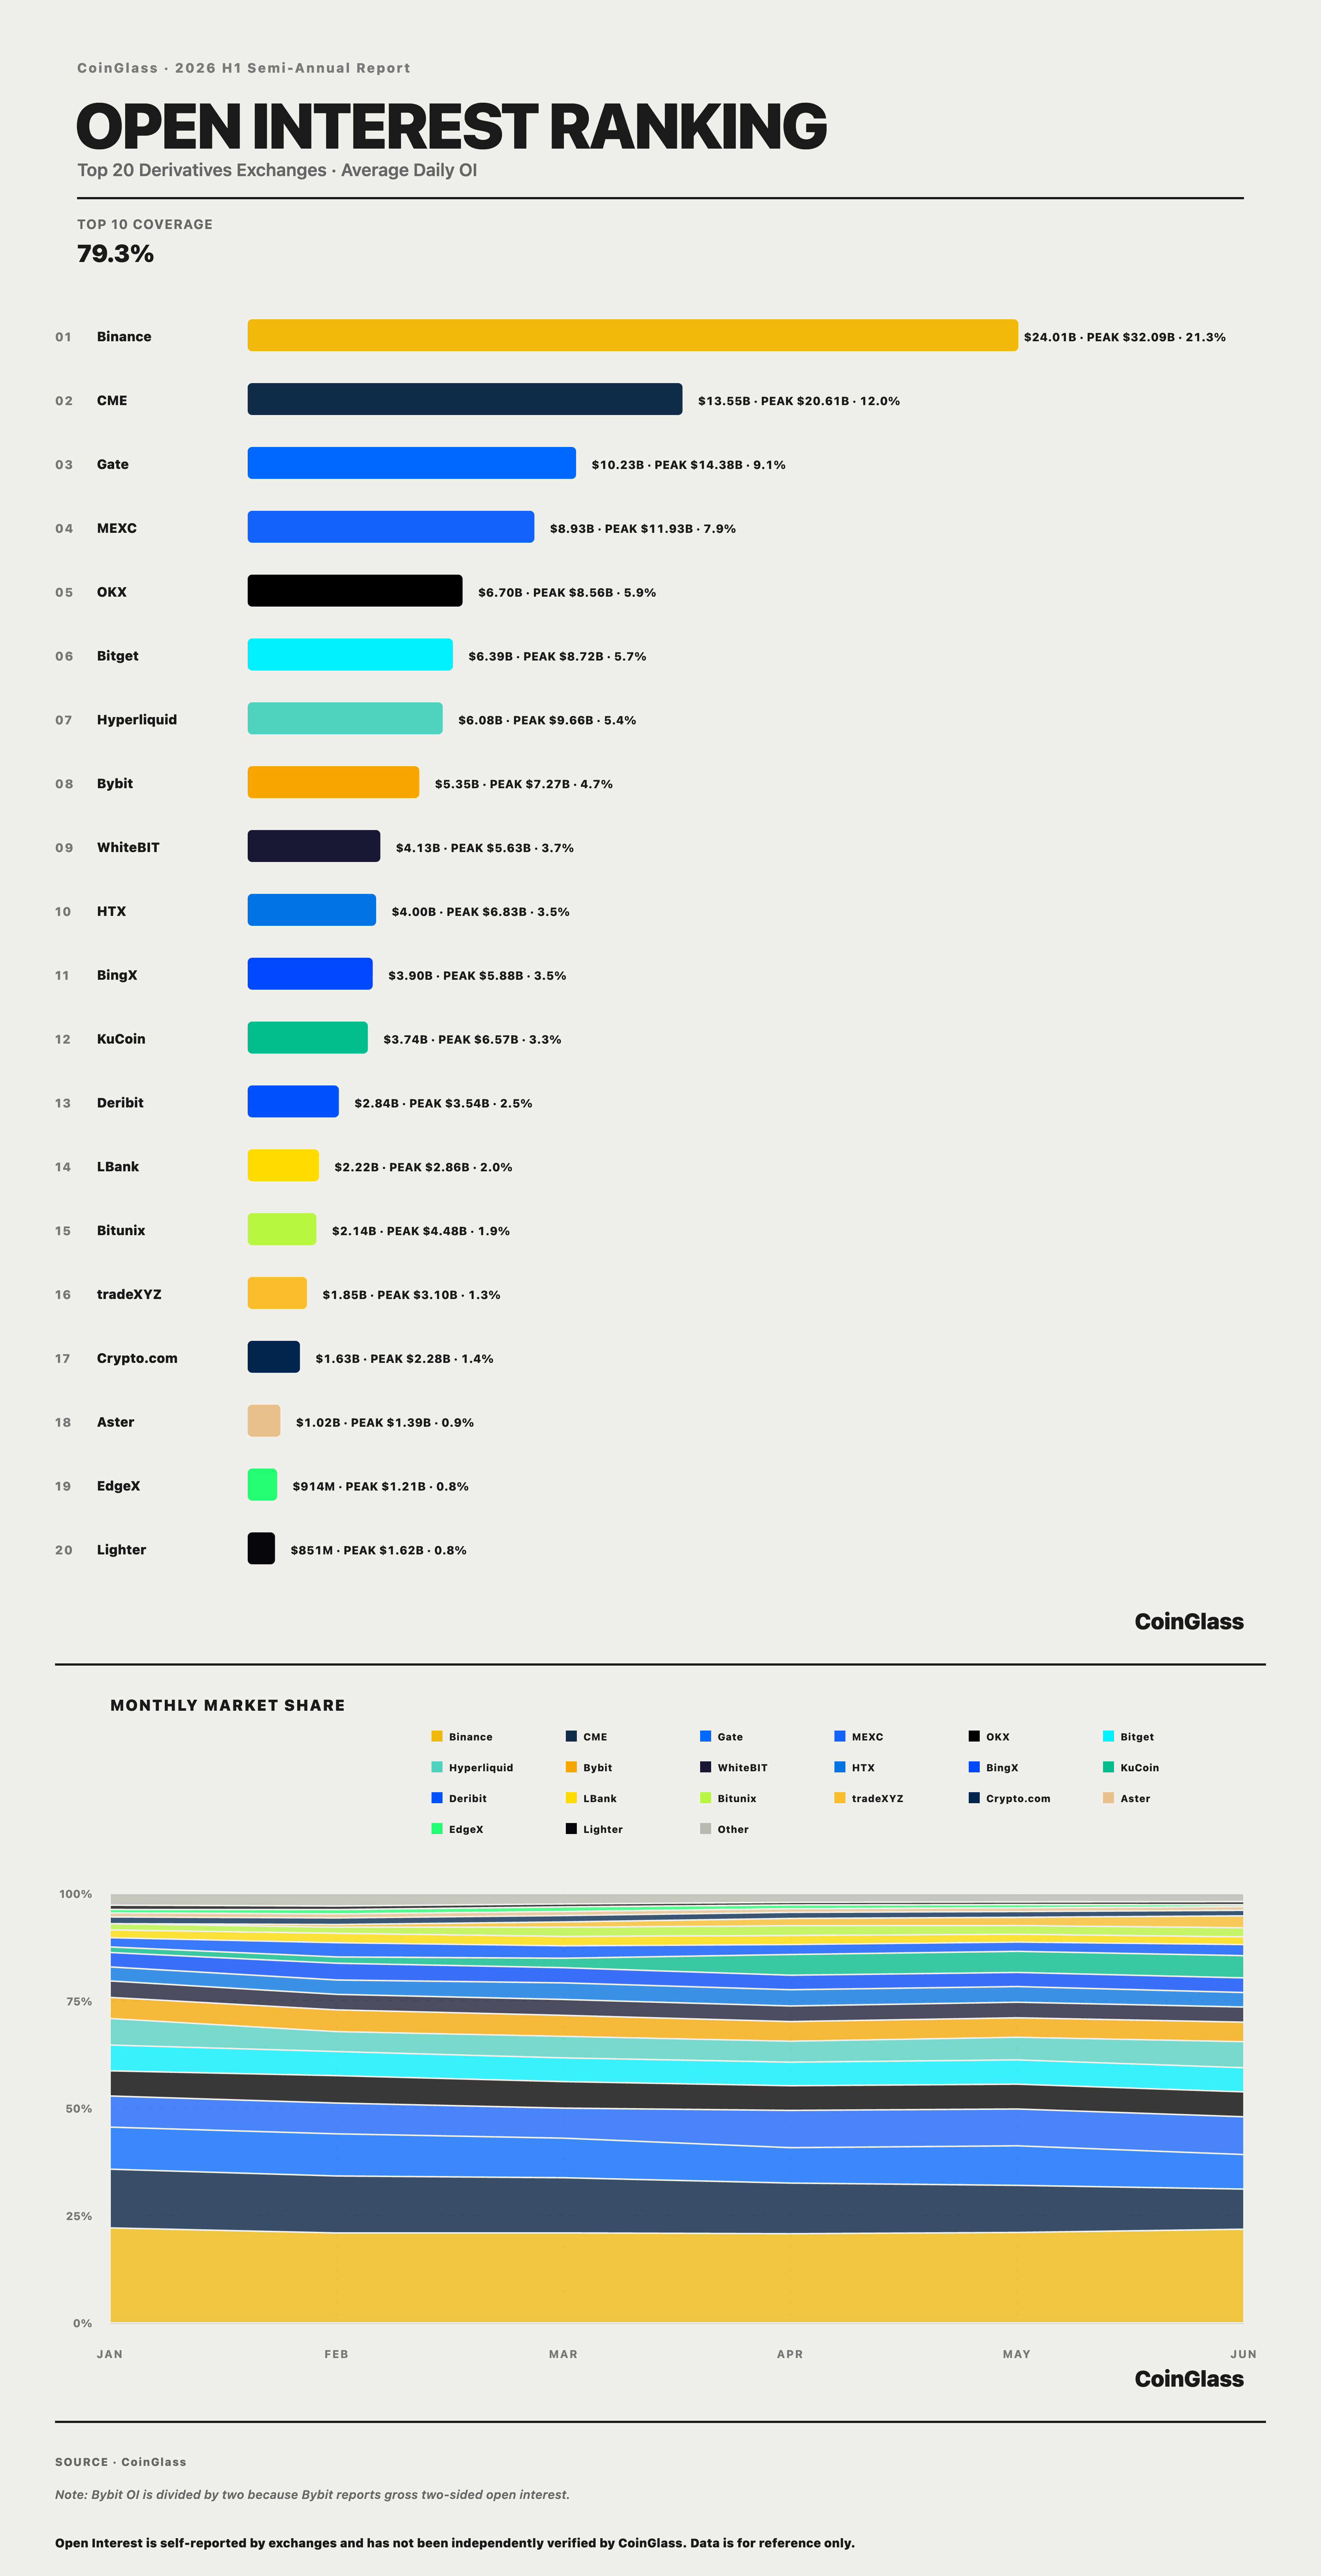
The Top 10 accounted for 79.3% of market-wide average daily OI, close to the 81.2% Top 10 coverage for volume, although the leading-exchange structure differed materially. Binance ranked first with average daily OI of US$24.01 billion and a 21.3% share; CME ranked second with US$13.55 billion and a 12.0% share. Gate, MEXC, and OKX recorded US$10.23 billion, US$8.93 billion, and US$6.70 billion, representing 9.1%, 7.9%, and 5.9%, and ranked third through fifth, respectively. Bitget ranked sixth with US$6.39 billion and a 5.7% share. The Top 5 accounted for 56.2%, below the 61.2% Top 5 coverage for volume.
CME accounted for 4.1% of volume but 12.0% of OI, with the latter approximately 3 times the former. Its weight in outstanding positions was therefore materially higher than its weight in trading turnover, consistent with a participant mix characterized by a greater prevalence of institutional hedging and basis strategies and relatively longer holding periods. Nevertheless, CME's monthly OI share fell from 13.7% in January to 9.3% in June, indicating a decline in its relative share over the period.
Binance's 26.6% share of volume exceeded its 21.3% share of OI, indicating more active trading turnover. Overall, crypto-native platforms dominated trading flows, while CME carried a relatively greater weight in outstanding positions, reflecting differences in participant mix and holding periods between the two market types.
III.III BTC/ETH Derivatives Liquidity Depth
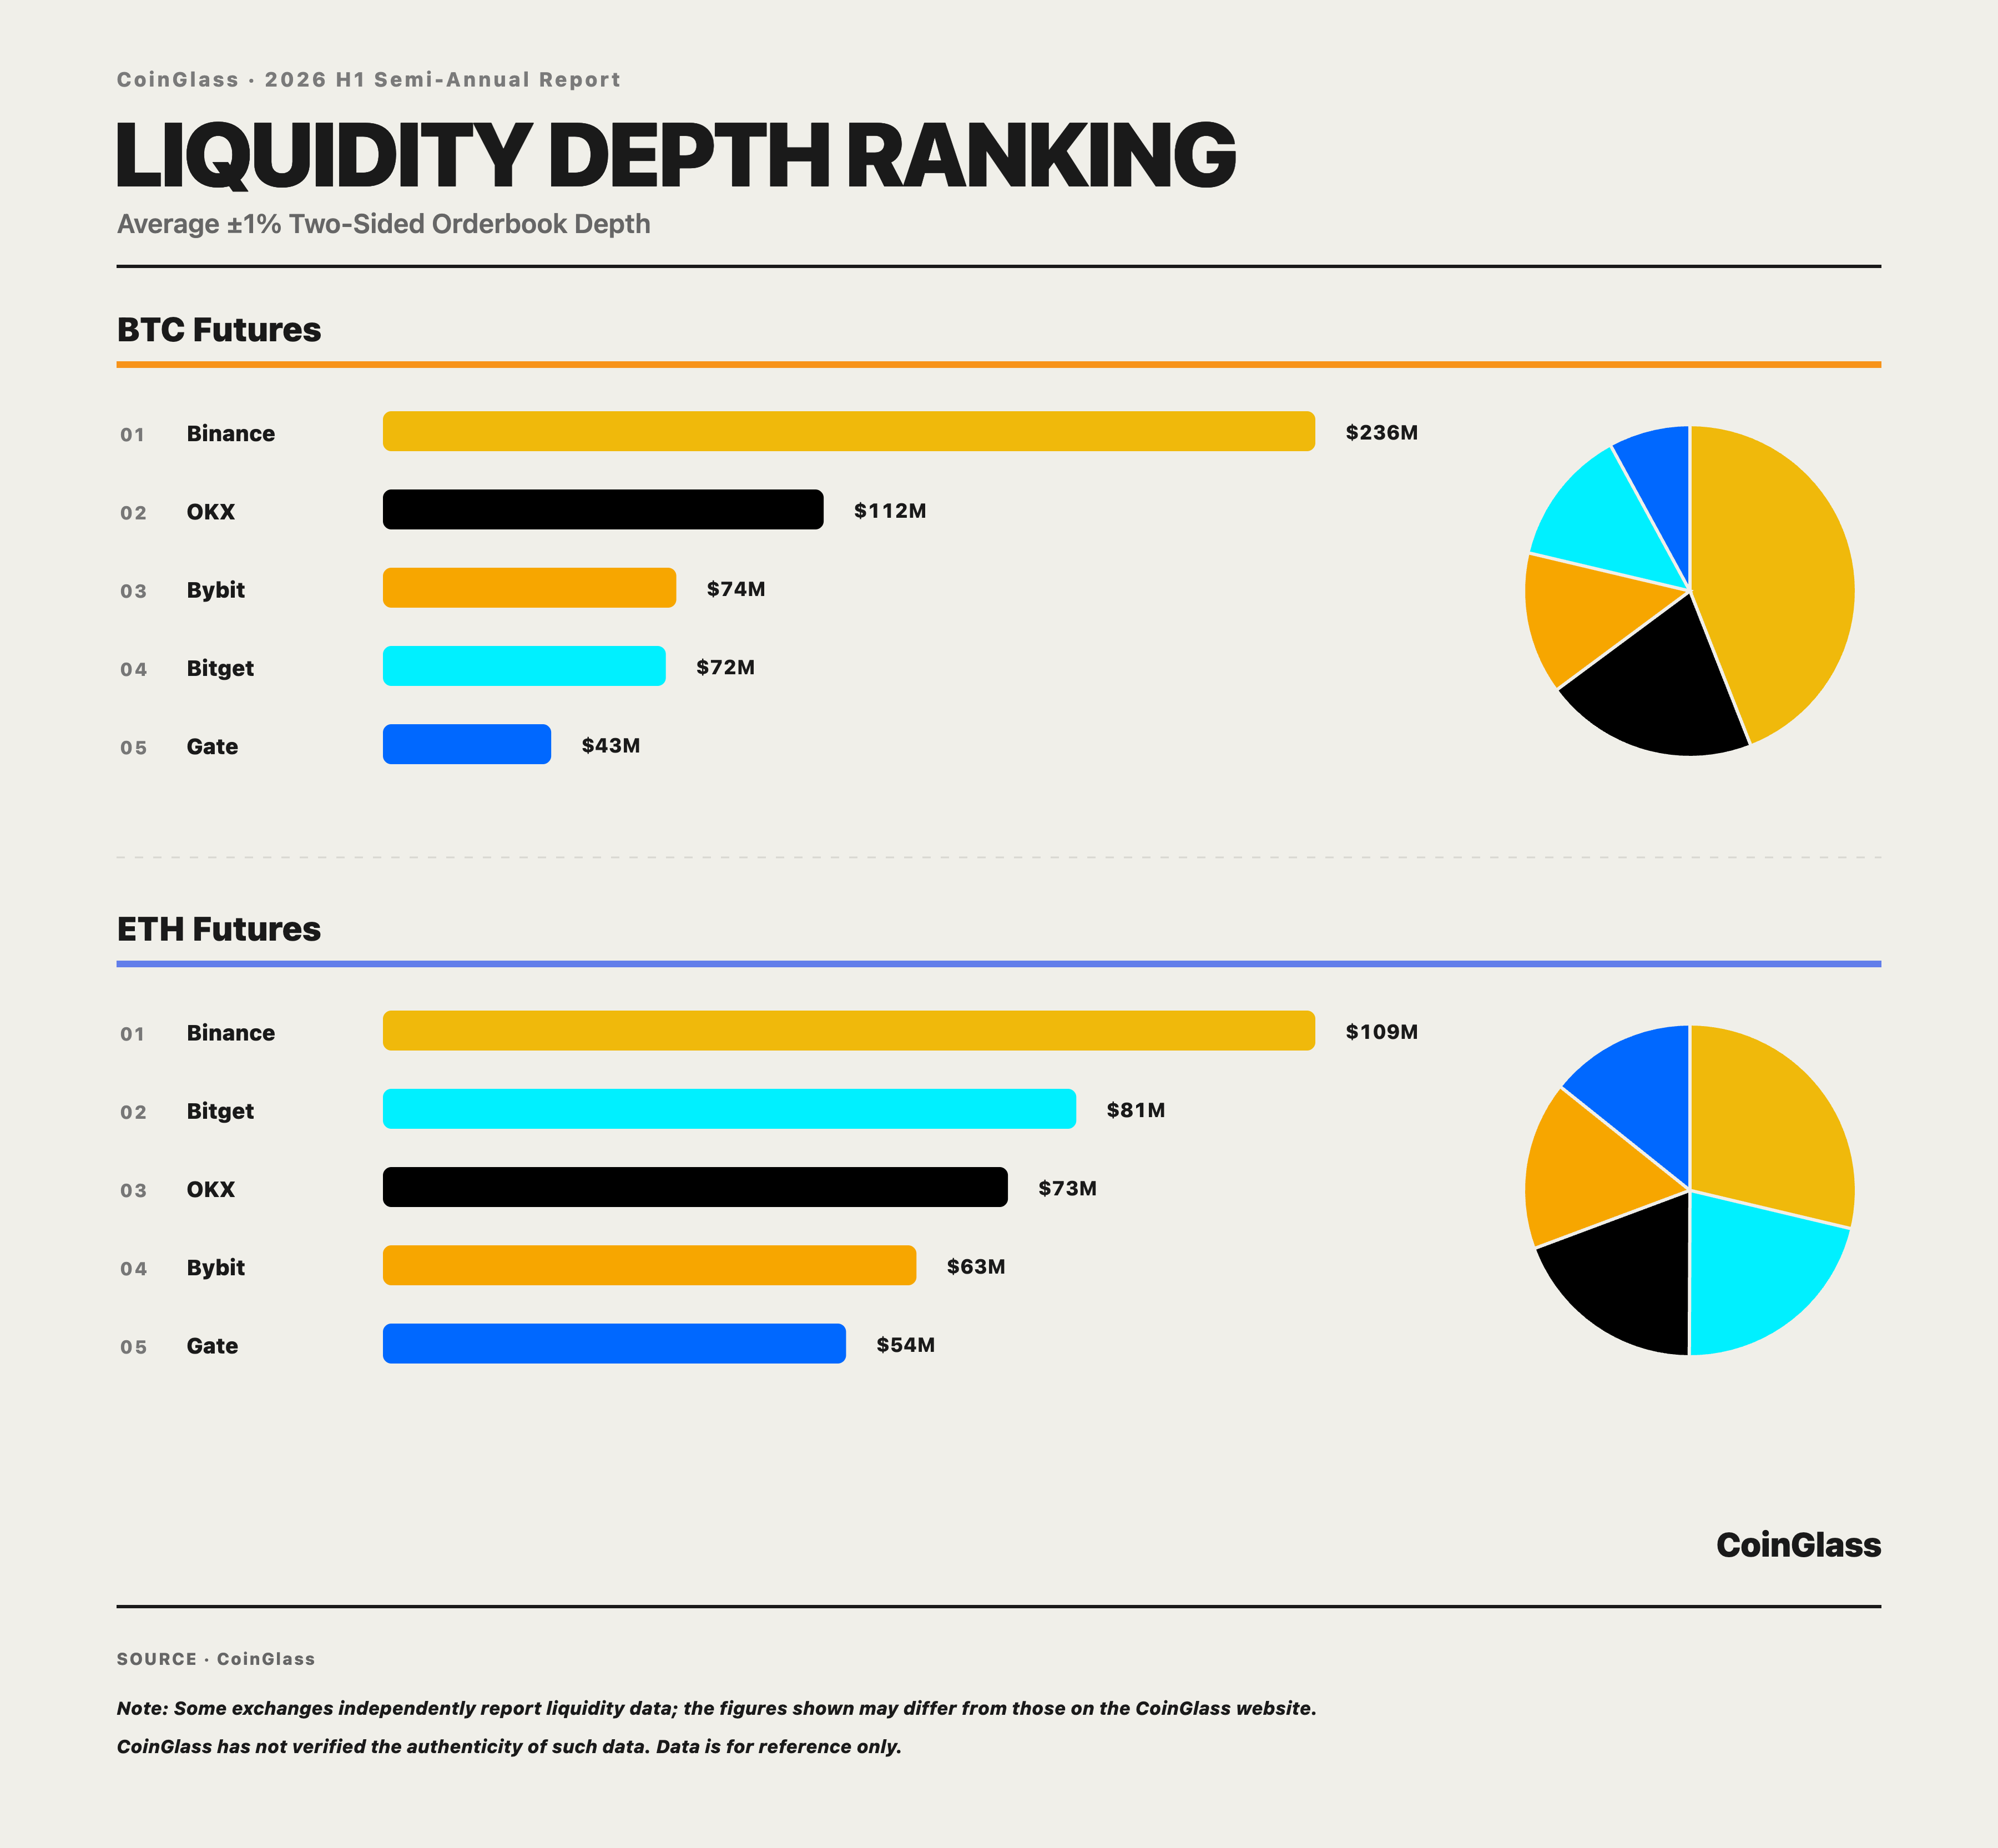
In H1 2026, two-sided BTC order-book depth within ±1% of the mid-price was concentrated primarily on Binance and OKX. Their respective depths were US$236 million and US$112 million, representing 44.0% and 20.8%, or 64.8% combined. Bybit and Bitget recorded US$74.36 million and US$71.70 million, accounting for 13.9% and 13.4%, respectively; Gate recorded US$42.64 million, or 7.9%. Executable liquidity for large BTC orders remained concentrated on a small number of leading venues.
ETH depth was more evenly distributed than BTC depth. Binance ranked first with US$109 million and a 28.7% share; Bitget, OKX, and Bybit recorded US$81.37 million, US$73.35 million, and US$62.61 million, representing 21.4%, 19.2%, and 16.4%, respectively; Gate recorded US$54.35 million, or 14.3%. The top two venues accounted for a combined 50.1%, 14.8 percentage points below BTC. Aggregate ETH depth across the five venues was approximately US$381 million, below BTC's US$537 million, but more evenly distributed across venues.
III.IV Proof of Reserves (PoR) for Derivatives Exchanges
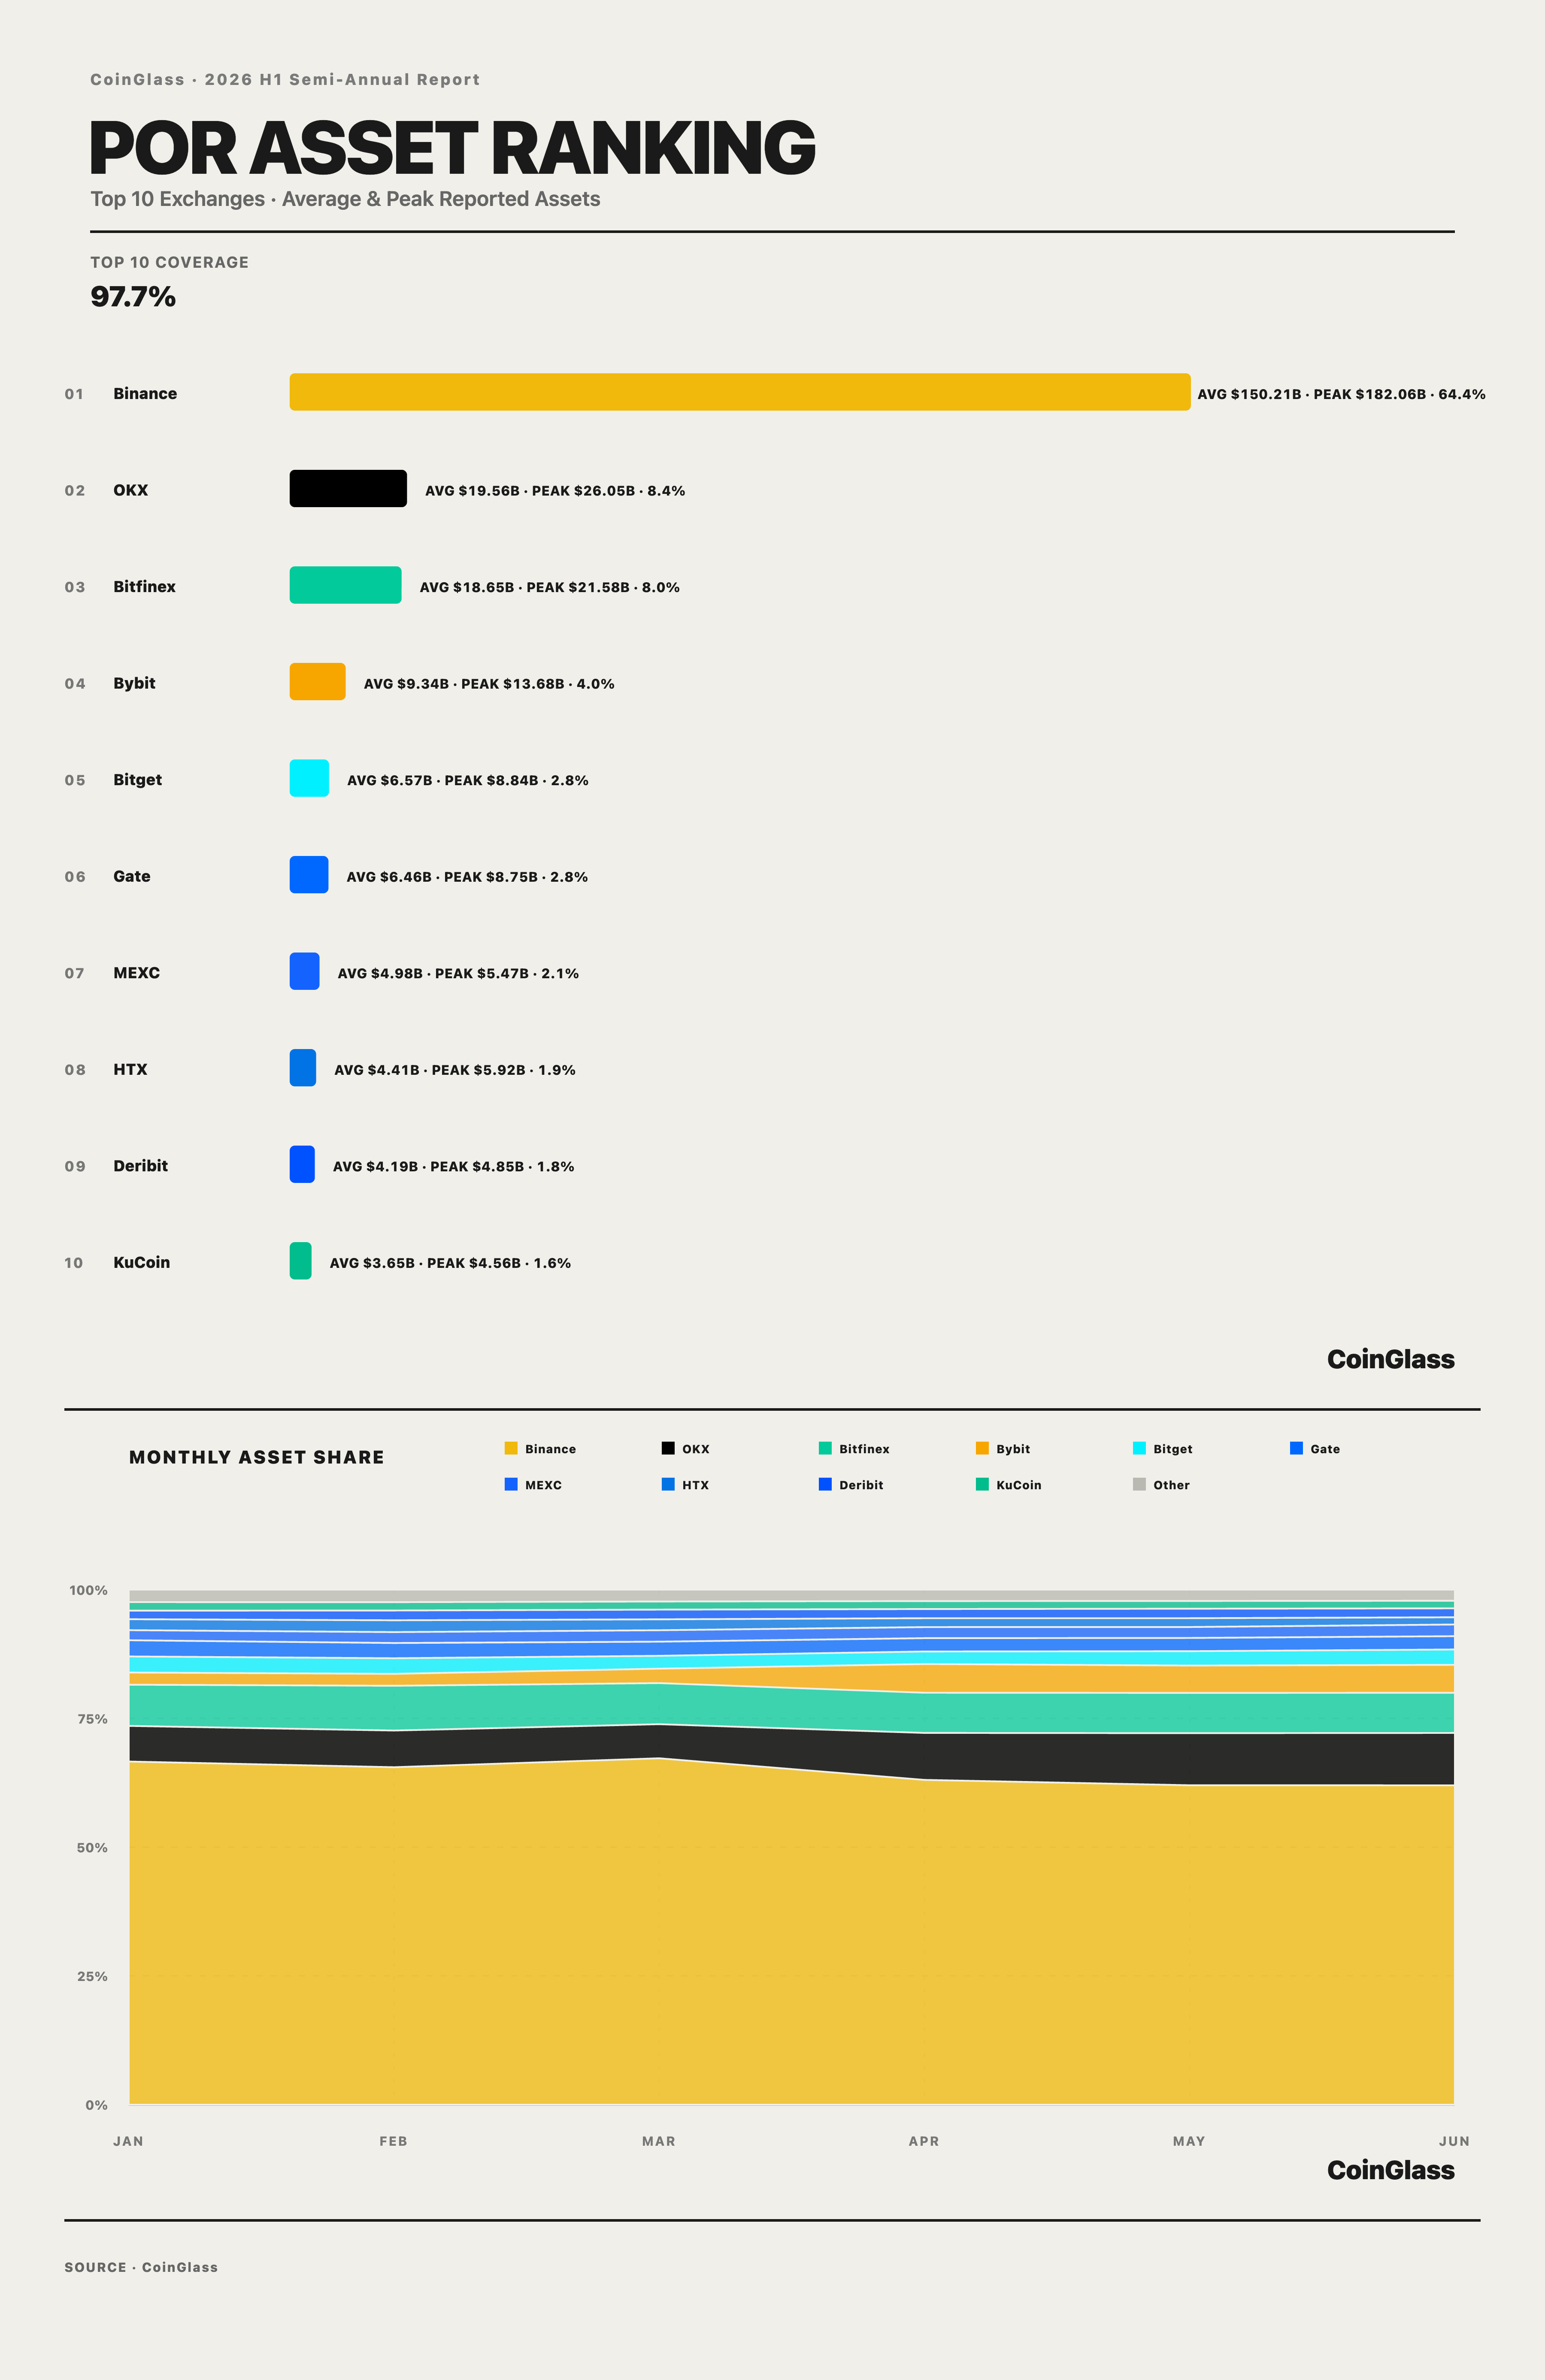
The 16 sample exchanges reported combined average daily user assets of approximately US$233.34 billion in H1, of which the Top 10 accounted for 97.7% and the Top 5 for 87.6%. Binance reported average daily user assets of approximately US$150.21 billion, or 64.4%; OKX and Bitfinex reported US$19.56 billion and US$18.65 billion, representing 8.4% and 8.0%, respectively. Bybit and Bitget accounted for 4.0% and 2.8%, ranking fourth and fifth. Gate, MEXC, HTX, Deribit, and KuCoin ranked sixth through tenth, respectively; MEXC ranked seventh with average daily reported user assets of approximately US$4.98 billion, or 2.1%. These figures reflect the relative distribution of USD-denominated user assets within the sample and may be affected by asset prices, asset quantities, wallet-address coverage, disclosure timing, and changes in classification methodology. Overall, the composition within the Top 10 rebalanced slightly, but user assets remained highly concentrated.
IV. Institutional Capital and TradFi Expansion
IV.I BTC and ETH ETF Flows
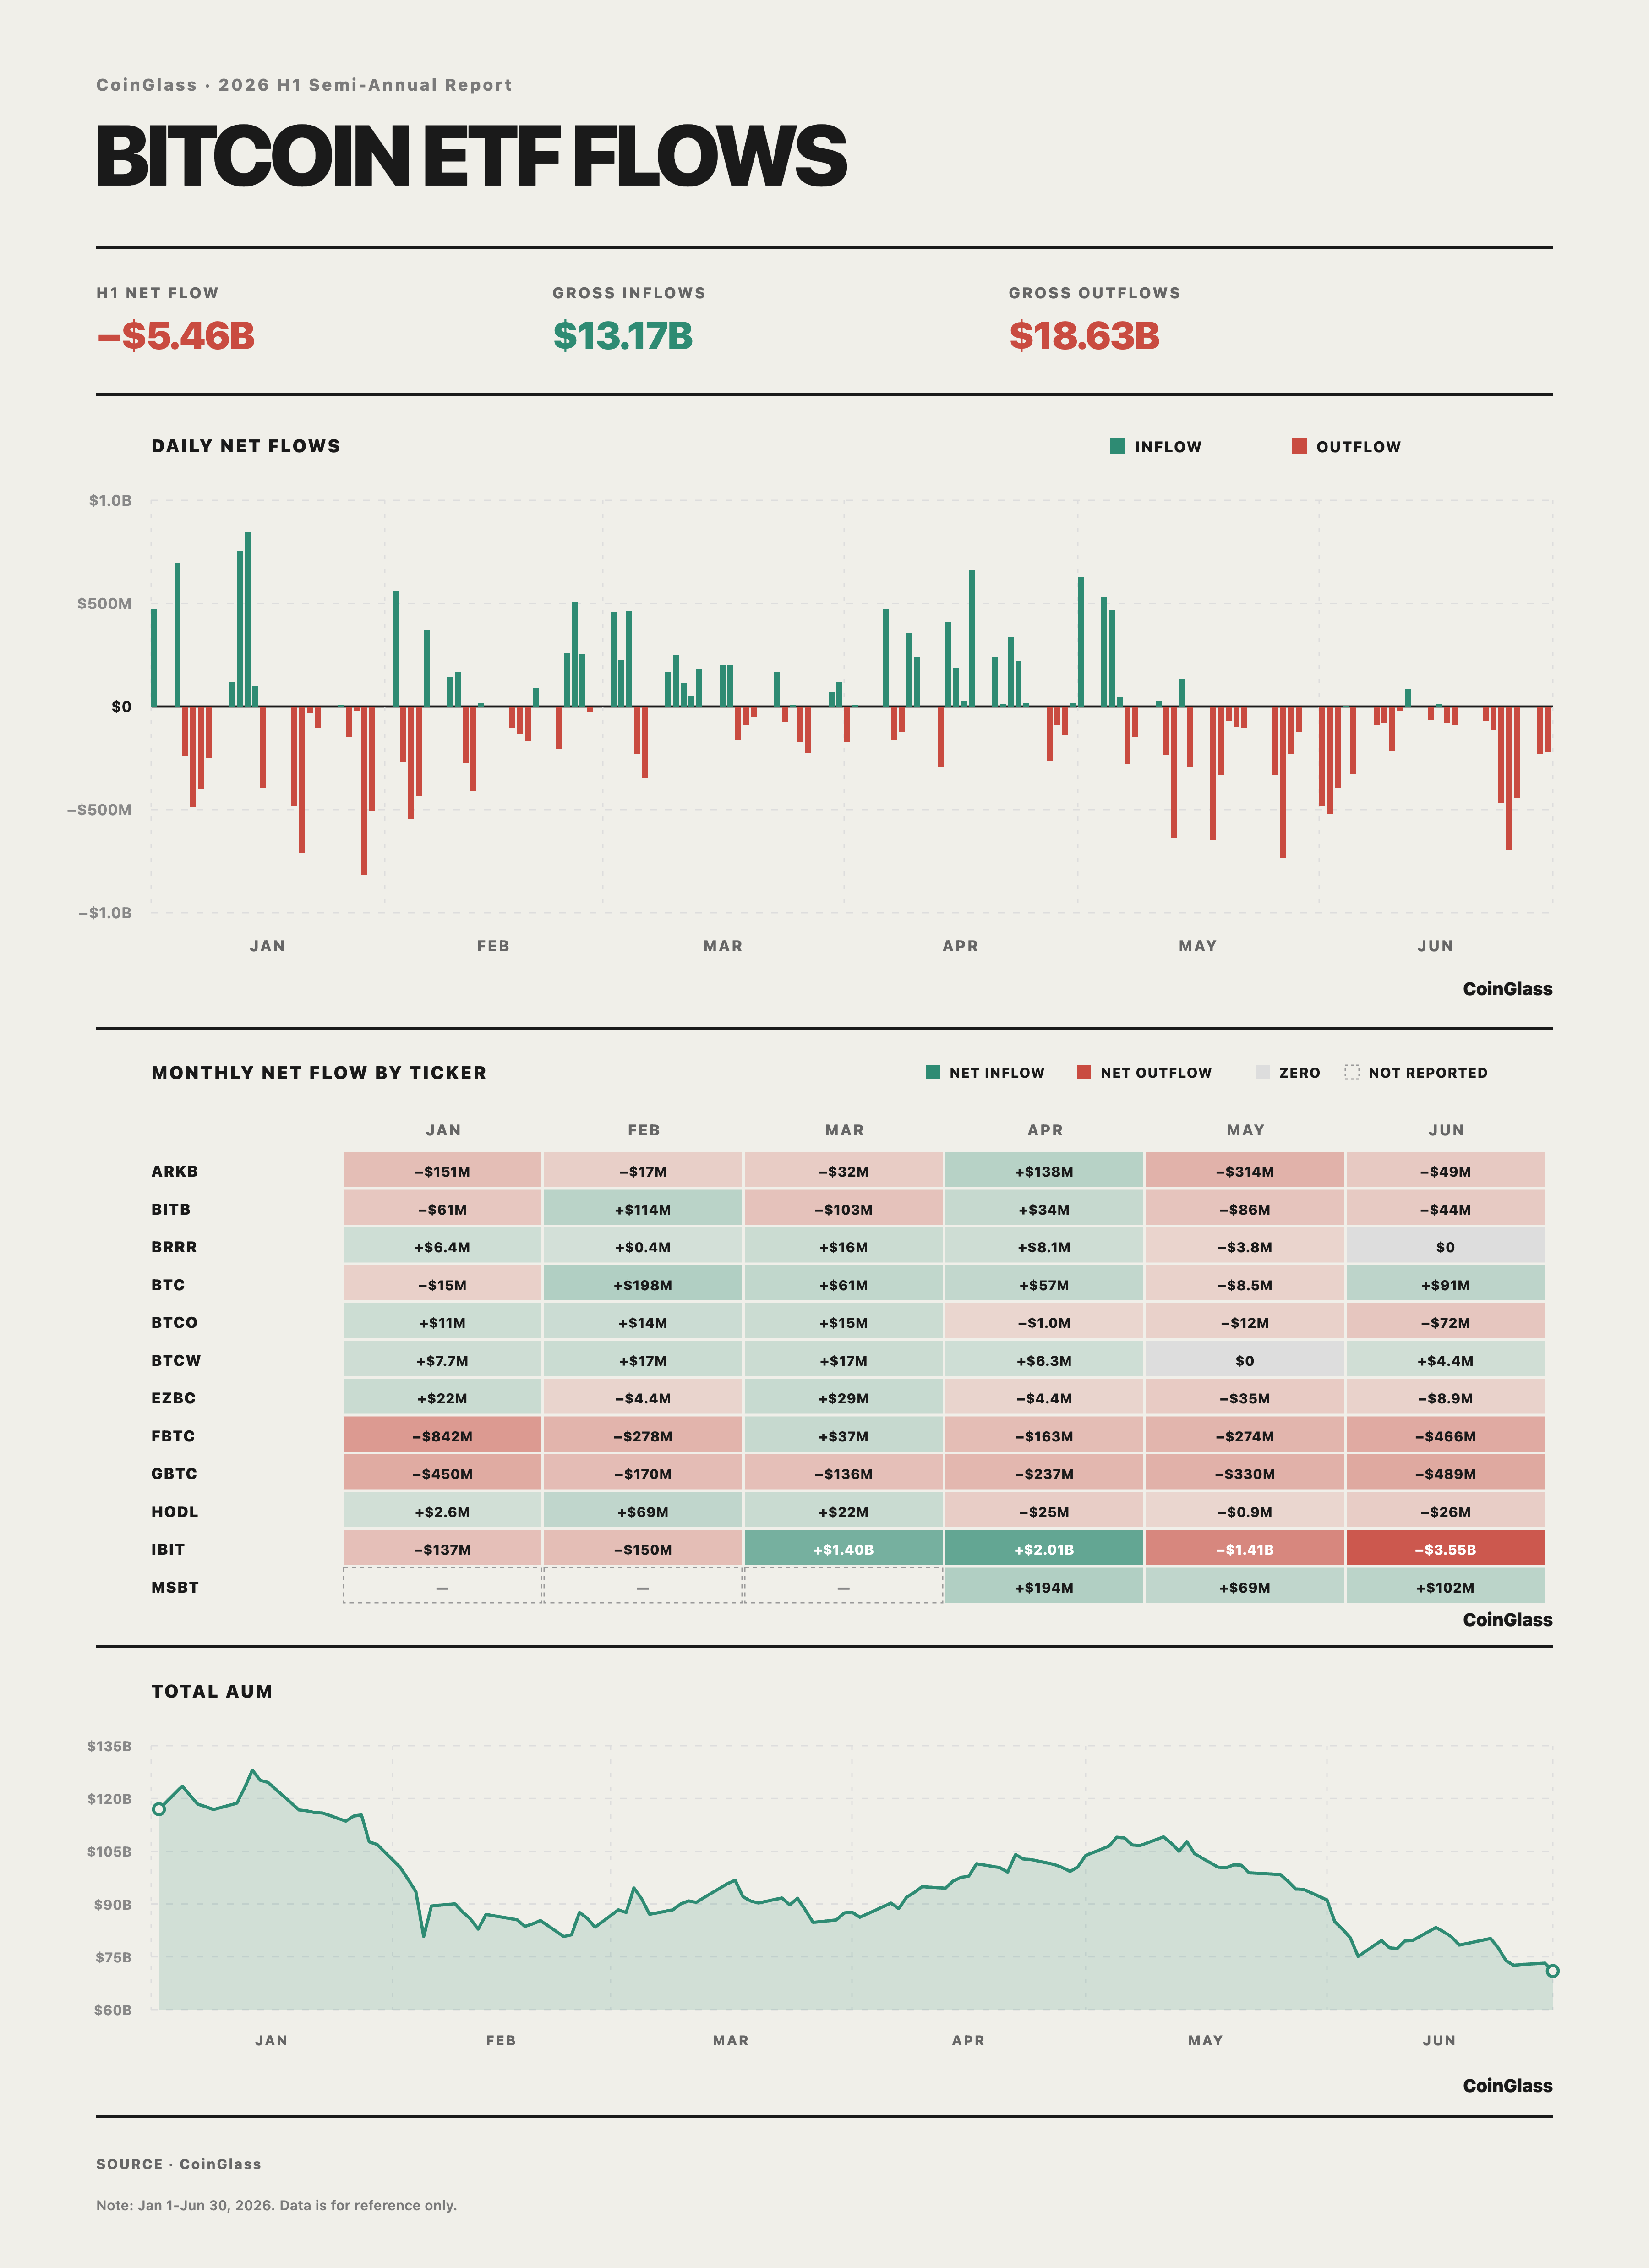
U.S. spot BTC ETFs recorded cumulative net outflows of US$5.460 billion in H1. Positive-flow trading days generated aggregate inflows of US$13.170 billion, while negative-flow trading days generated aggregate outflows of US$18.630 billion, indicating that two-way flows remained active but redemptions prevailed overall. Monthly net flows were outflows of US$1.606 billion in January and US$207 million in February; March and April shifted to inflows of US$1.322 billion and US$1.966 billion; and May and June reverted to outflows of US$2.425 billion and US$4.510 billion. The improvement from March through April was fully offset by outflows in the following two months, concentrating funding pressure near the end of H1.
BTC ETFs did not achieve sustained net subscriptions in H1, and the large outflow in June further weakened period-end funding conditions. In H2, attention should focus on whether net inflows can be sustained and whether fund shares and total assets can grow steadily after excluding price effects. A short-term or single-month return to positive flows remains insufficient to confirm a reversal in the institutional allocation trend.
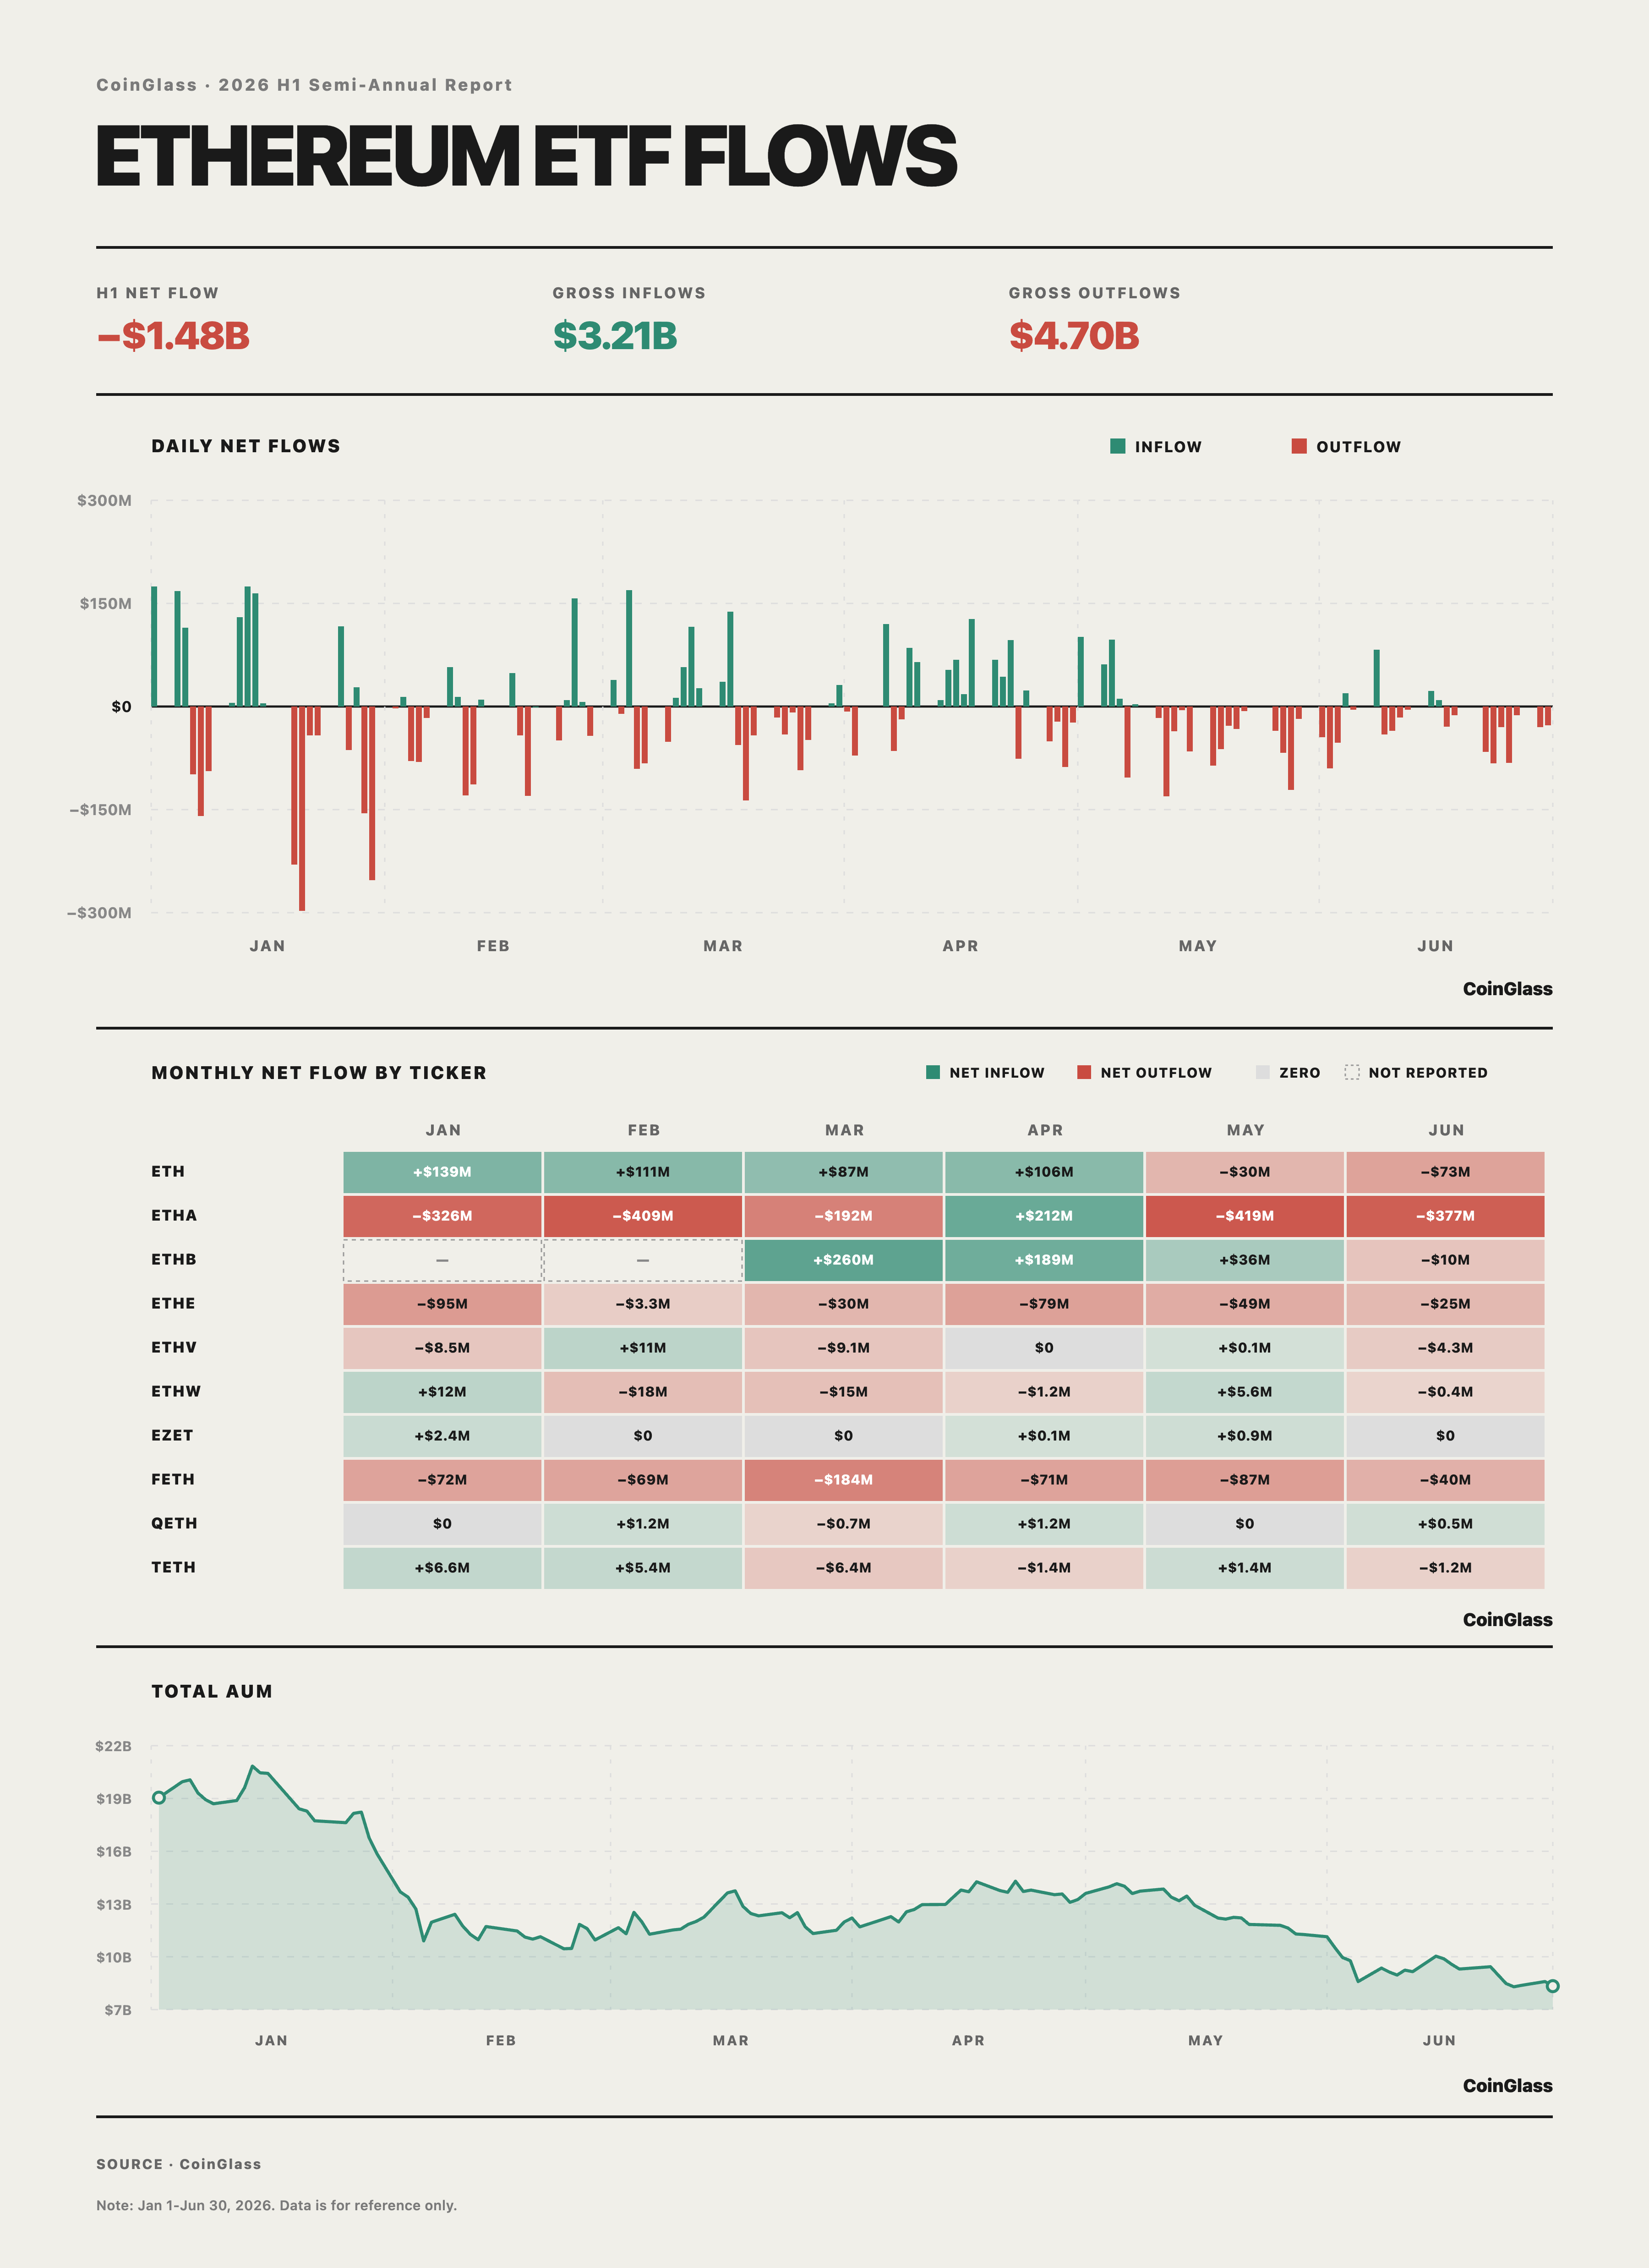
ETH ETFs recorded cumulative net outflows of US$1.483 billion in H1, with aggregate inflows of US$3.215 billion on positive-flow trading days and aggregate outflows of US$4.698 billion on negative-flow trading days. Monthly net outflows were US$353 million in January, US$370 million in February, and in March, the net outflow was US$46 million. April shifted to a net inflow of US$356 million, while May and June reverted to net outflows of US$541 million and US$529 million. The brief recovery in April did not persist, and period-end flows remained weak.
Total assets in ETH ETFs fell from US$19.05 billion on January 2 to US$8.33 billion on June 30, after reaching a period peak of US$20.84 billion on January 14. Changes in total assets reflected both net subscriptions and redemptions and movements in the ETH price and therefore cannot be attributed entirely to outflows. Although net outflows from ETH ETFs were lower than those from BTC ETFs, the ETH ETF asset base was smaller, making the relative effect of flow changes more pronounced. Given the differences between the two product categories in asset size, product structure, and subscription and redemption cadence, BTC and ETH ETFs should be assessed separately.
IV.II Strategy BTC Holdings
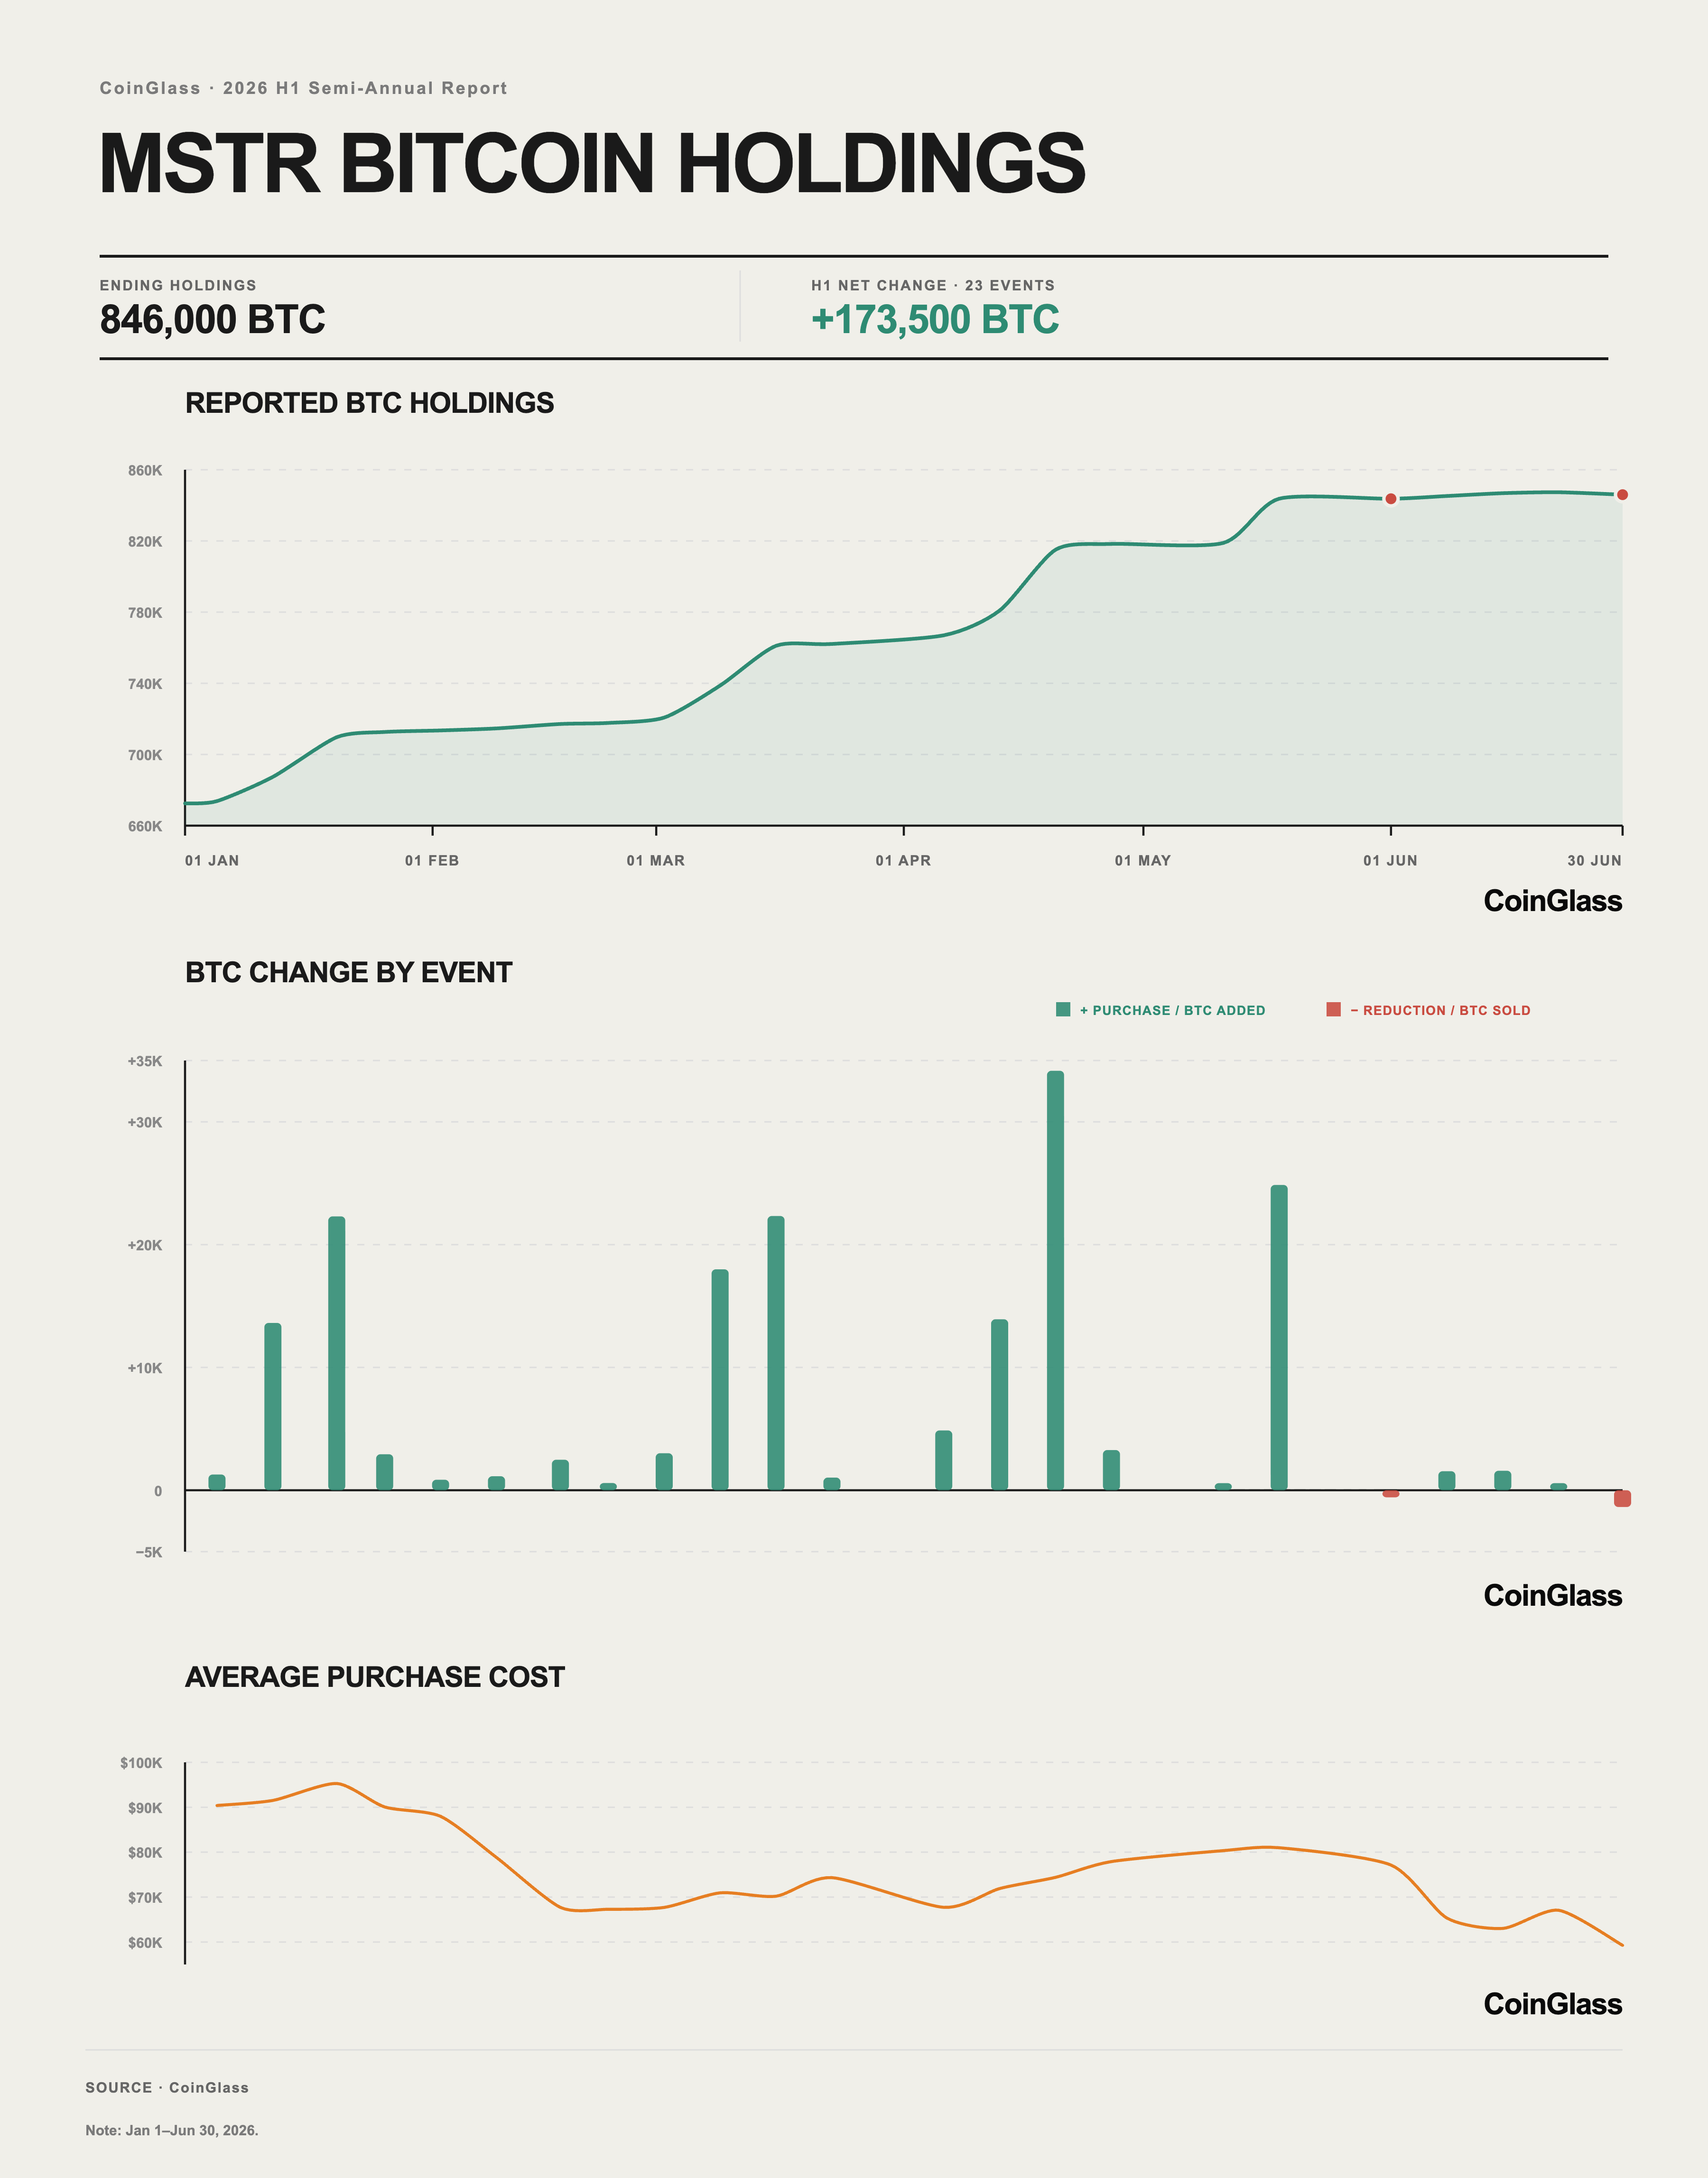
Strategy held 672,500 BTC at the start of the year and 846,000 BTC on June 30, a net increase of 173,500 BTC, or 25.8%, in H1. However, the expansion in holdings was not one-directional: the company sold 32 BTC from May 26 through May 31, raising approximately US$2.5 million to fund preferred-stock distributions; it sold another 1,363 BTC from June 29 through June 30, raising US$80.8 million to fund preferred-stock distributions and replenish its U.S. dollar reserve.
Monthly net additions were 40,147 BTC, 5,075 BTC, 44,377 BTC, 56,235 BTC, 25,404 BTC, and 2,262 BTC, respectively. March and April together contributed 58.0% of the H1 net increase, while the pace of accumulation slowed materially in June. On June 29, the company also introduced a BTC monetization plan authorizing BTC sales under specified conditions to fund its U.S. dollar reserve, preferred-stock dividends, interest expense, and securities repurchases. The plan had a maximum capacity of US$1.25 billion but did not constitute a commitment to sell.
The two sales together represented only approximately 0.16% of period-end holdings and did not alter the H1 net accumulation trend. Their significance was that Strategy had begun converting BTC from a pure reserve asset into a source of funds for liability management and liquidity support. MSTR shares rose 4.9% on the day the plan was announced, with market attention focusing more on the information effect: BTC had shifted from a long-term reserve asset to an asset that could be used for liability and liquidity management.
Over the same period, U.S. spot BTC ETFs recorded net outflows of US$5.46 billion, while Strategy added a net 173,500 BTC, demonstrating continued divergence across institutional channels; however, corporate balance-sheet demand no longer represented unconditional, one-way buying. In H2, attention should focus on Strategy's BTC reserve sales frequency, the coverage provided by its U.S. dollar reserve, and pressure from preferred-stock obligations. If sales shift from occasional adjustments to sustained activity, Strategy could move from being a source of marginal demand to a source of two-way flows and increase the market's sensitivity to changes in its capital structure. Together, these developments indicate that institutional participation did not retreat in unison, but that funding horizons, financing constraints, and risk tolerance were diverging across channels.
IV.III Monthly TradFi Contract Volume Trends
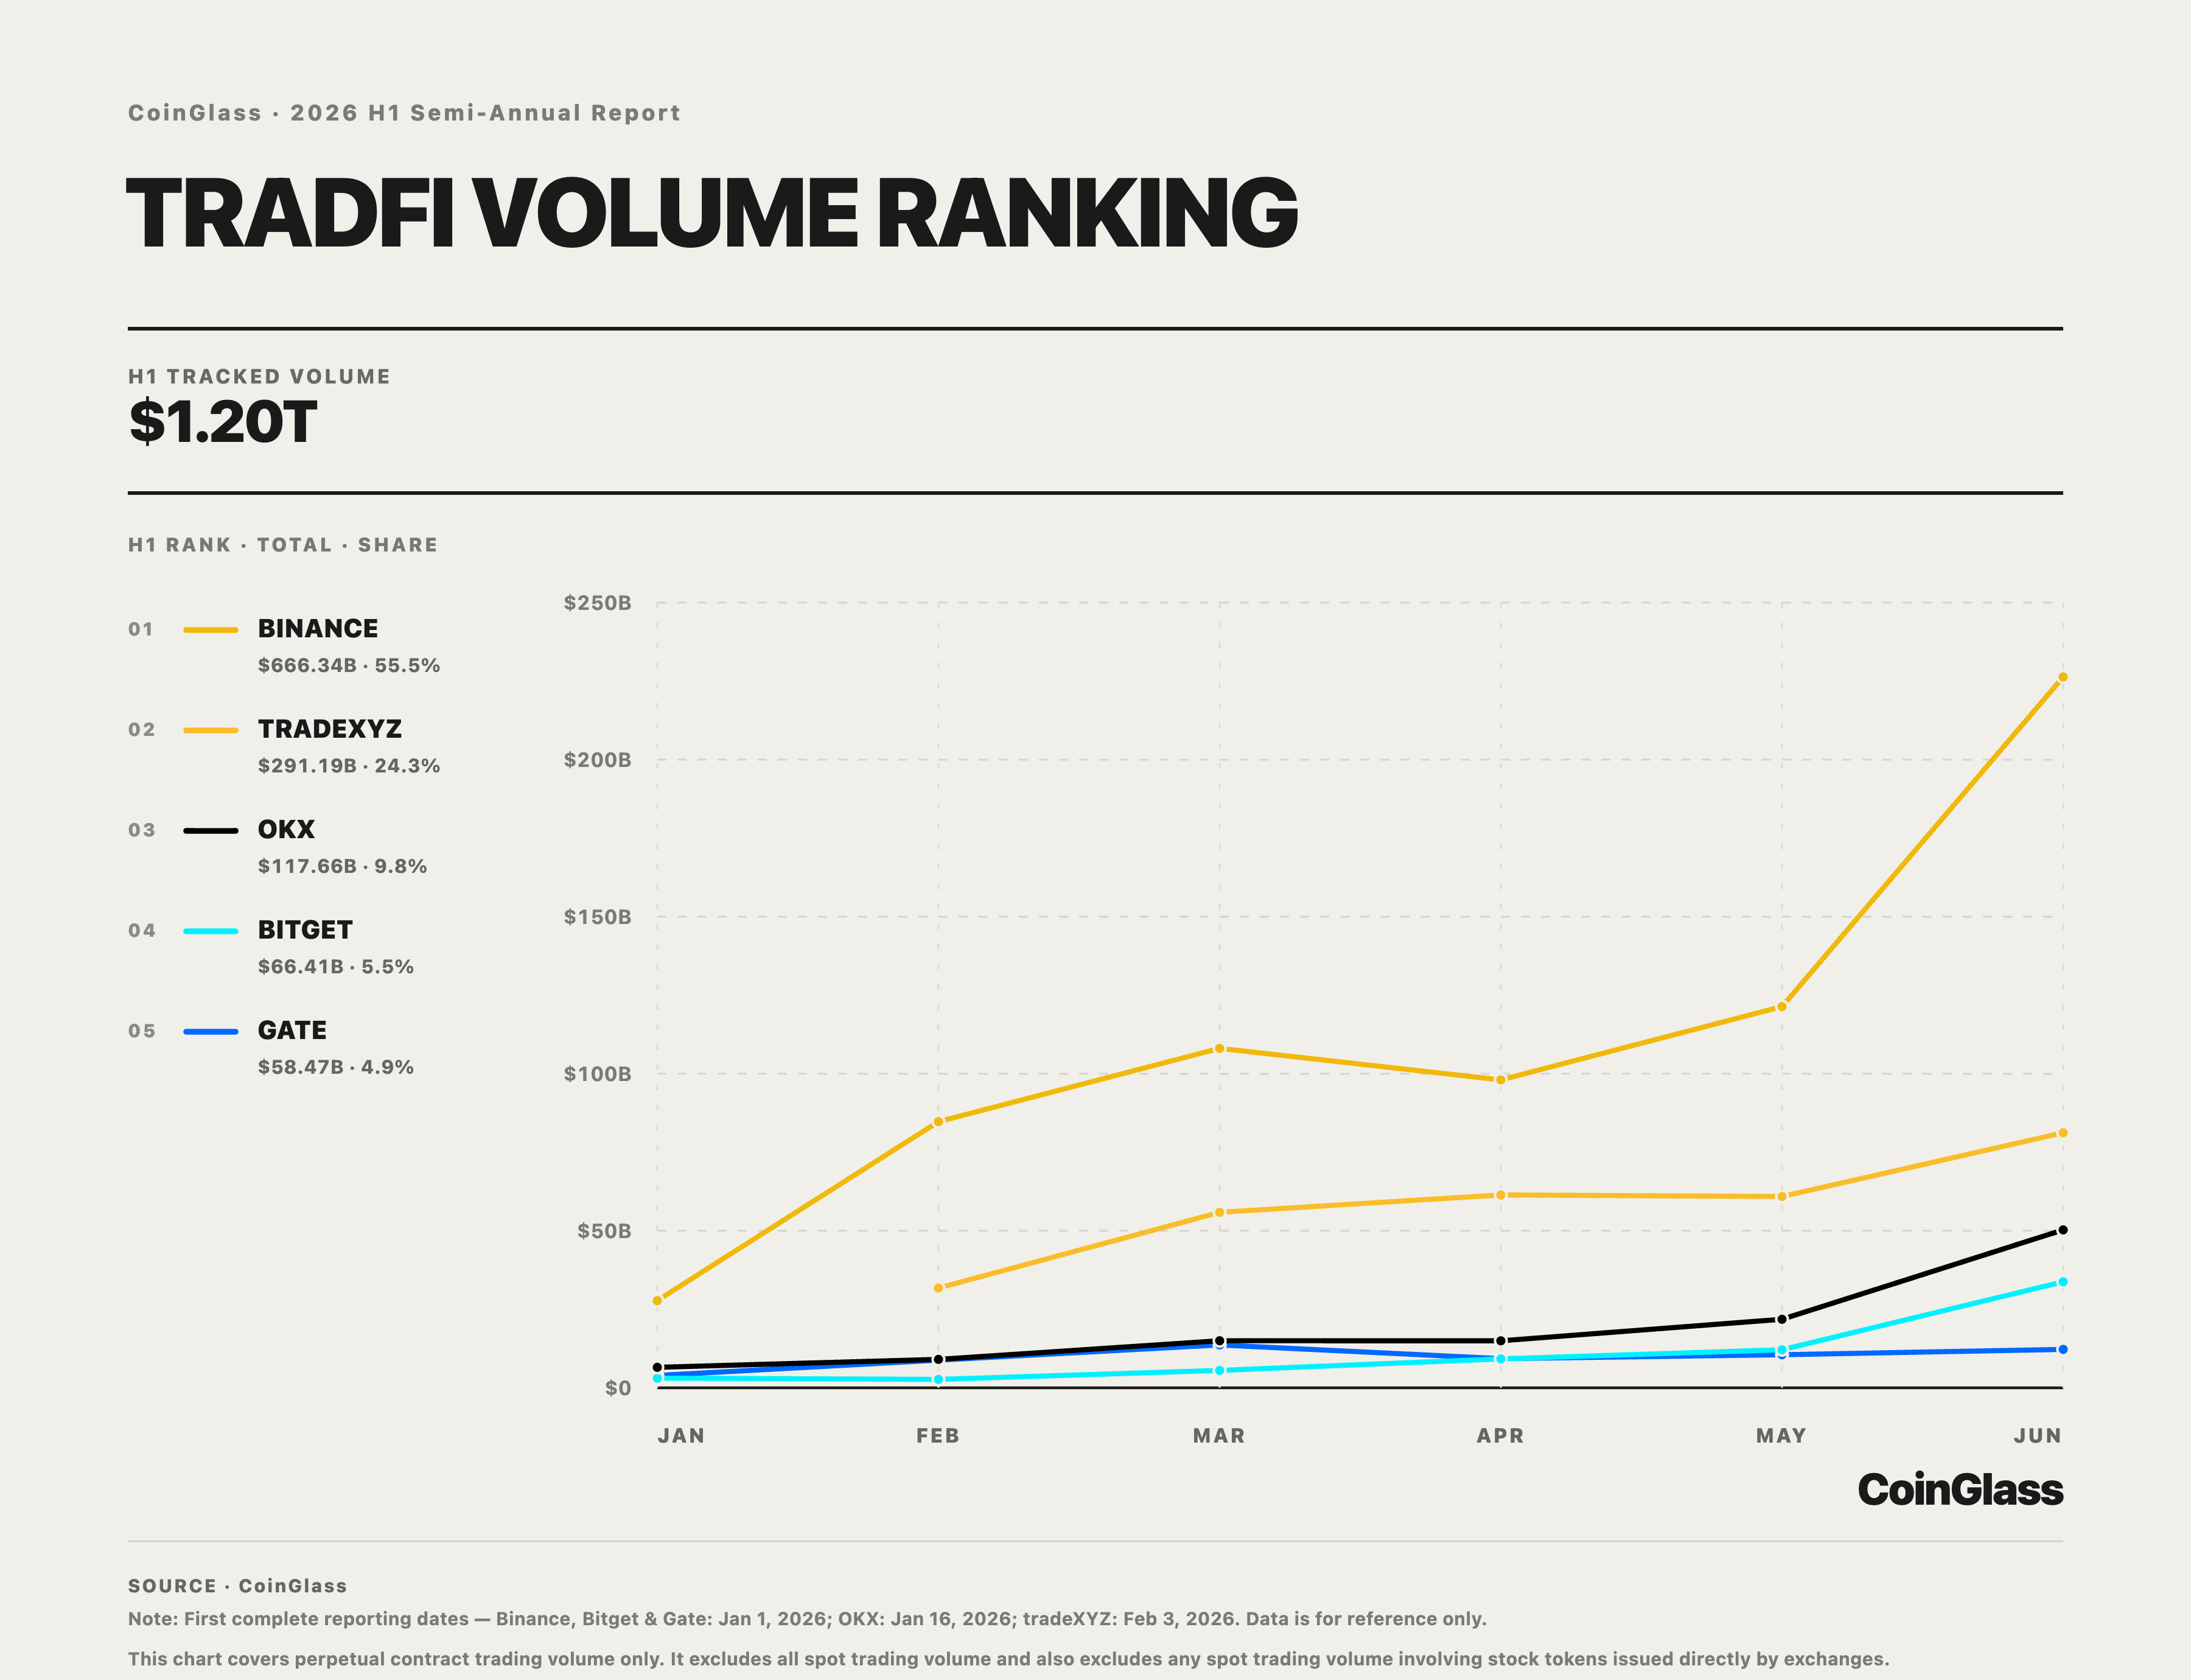
In H1 2026, TradFi perpetual contract volume across the five sample exchanges totaled approximately US$1.20 trillion. The contracts covered traditional assets including equities, ETFs, equity indices, commodities, and foreign exchange, and excluded spot trading and spot trading in exchange-issued tokenized stocks. Monthly volume rose from US$41.31 billion in January to US$137.07 billion in February and US$198.15 billion in March, before easing to US$192.92 billion in April, rising to US$226.77 billion in May, and increasing further to US$403.85 billion in June. June accounted for 33.7% of the H1 total, with the increase in volume clearly concentrated near period-end.
Market share was highly concentrated. Binance recorded US$666.34 billion in volume, or 55.5%; tradeXYZ recorded US$291.19 billion, or 24.3%; and OKX recorded US$117.66 billion, or 9.8%. Together, the three accounted for 89.6%. Bitget and Gate recorded US$66.41 billion and US$58.47 billion, representing 5.5% and 4.9%, respectively. At this stage, growth in TradFi perpetual contracts remained driven primarily by a small number of platforms, with the market characterized by product expansion and liquidity concentration among leading venues.
V. Summary
Overall, the cryptocurrency derivatives market did not undergo linear deleveraging in H1 2026; instead, contracting trading turnover, periodic position rebuilding, and concentrated risk unwinding occurred simultaneously. Market-wide volume was US$35.08 trillion, down 15.7% year over year; average daily OI was US$112.7 billion, down 10%, and although it increased 2.1% quarter over quarter in Q2, it ended the period 17.9% below the start of the year, indicating that outstanding exposure contracted more slowly than trading activity cooled and that the recovery in positions from April through May did not persist through period-end. Liquidations totaled US$73.35 billion over the same period, with long liquidations accounting for 62.2%. June recorded the highest monthly liquidation total in H1, and risk continued to unwind primarily during a small number of volatility windows.
In terms of market structure, the Top 10 coverage ratios for volume and OI were 81.2% and 79.3%, respectively, while the top two venues accounted for 64.8% of BTC depth and 50.1% of ETH depth. Trade execution, risk transfer, and liquidation absorption continued to depend on leading venues.
Institutional channels diverged materially. Spot BTC and ETH ETFs recorded net outflows of US$5.46 billion and US$1.483 billion, respectively; Strategy still added a net 173,500 BTC but had begun selling BTC to manage liquidity and liabilities; and CME retained a substantial weight in outstanding positions. TradFi contract volume reached approximately US$1.20 trillion, although its growth remained affected by expanded disclosure coverage. Differences across channels in funding sources, holding periods, and risk constraints widened further.
In H2, attention should focus on whether the recovery in volume can persist and whether ETF flows and corporate balance-sheet allocations can improve in tandem. The market recovery will become more durable only if trading activity, capital absorption, and institutional demand achieve broader alignment.
Disclaimer
CoinGlass.com. All rights reserved. CoinGlass and related marks are trademarks of CoinGlass.com (hereinafter "CoinGlass") or its affiliates. The views and opinions expressed in this material are solely those of the author and do not necessarily reflect the official position or views of CoinGlass. The information and analysis concerning cryptocurrencies and related topics provided in this material are for informational purposes only and are intended solely for investors with relevant investment experience. This content does not constitute: (i) an offer or solicitation to invest in or buy or sell any cryptocurrency, digital asset, financial instrument, or security, or to participate in any specific investment or trading strategy; (ii) accounting, legal, tax, or investment advice or recommendations; or (iii) an official statement by CoinGlass.
Unless otherwise stated, all data in this report are sourced from CoinGlass and cover the period from January 1 through June 30, 2026. CoinGlass makes no express or implied representation or warranty regarding the accuracy, completeness, timeliness, or reliability of the information in this material, or the future performance of any cryptocurrency, digital asset, financial instrument, market condition, or economic indicator. The information herein is considered accurate as of the publication date but may not be updated or revised in response to subsequent information or changes in circumstances. CoinGlass has not independently verified this information and makes no representation as to its current or long-term accuracy or its suitability for any particular circumstances. Certain statements herein may contain projections or forward-looking statements, and no assurance is given as to their accuracy or realization. Past performance referenced herein is not indicative of future performance. Readers should consult their professional advisers before making any investment decision. In addition, this content is not directed at or intended for use by any investor or prospective investor and must not, under any circumstances, be relied upon as the basis for a decision to purchase or sell any asset.
CoinGlass and its affiliates and employees may hold financial interests in, or have relationships with, certain cryptocurrencies, assets, entities, or services discussed herein. Any links provided herein are offered solely for readers' convenience and do not imply CoinGlass's endorsement or approval of any third-party website or its content.
Any unauthorized use, copying, forwarding, distribution, or republication of all or any part of this content, in any form, is strictly prohibited without the express permission of CoinGlass. CoinGlass provides data analytics and information services only and does not engage in virtual-currency trading, custody, or payment services.