Solana ETF
SOLZ
SOLZ
Nasdaq
Miscellaneous
Investment Trusts/Mutual Funds
10.24
USD-0.47
-4.39%
Fermé: 10-22 20:00 (UTC+0)
10.18
USD-0.06
-0.59%
Post-marché: 10-23 00:00 (UTC+0)
SOLZ Statistiques clés
Haut
10.40
Ouverture
10.33
Volume
857.47K
Bas
10.18
Clôture précédente
10.71
Valeur négociée
8.79M
Plus haut 52 sem.
21.32
Vol. relatif
0.859
Amplitude (%)
2.06%
Plus bas 52 sem.
6.17
Taux de rotation
7.60%
Cap. Marché
--
PER (TTM)
--
PER (Annuel)
--
P/B
--
P/S
--
Bénéfice par action (BPA)
--
Dividende (TTM)
--
Rendement du dividende
--
Actions en circulation
11.28M
Devise
USD
SOLZ Performance du Prix
7 jour

30 jour

90 jour

180 jour
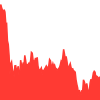
Depuis le début de l’année
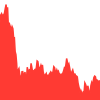
1 An
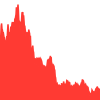
SOLZ Répartition des flux monétaires
SOLZ Volume quotidien des ventes à découvert
SOLZ Historique du short interest
SOLZ Aperçu de l’action
Au 2026-10-23, le cours de l’action Solana ETF (SOLZ) s’établit aujourd’hui à 10.24. Sur la base de ce cours, la société affiche une capitalisation boursière de -- et un ratio cours/bénéfice de --.
Le 2026-10-23, SOLZ s’est négociée entre 10.18 et 10.40. Le cours actuel se situe 0.59% au-dessus du plus bas intrajournalier et 1.54% en dessous du plus haut intrajournalier, ce qui situe SOLZ dans la partie basse de sa fourchette de négociation la plus récente.
Le volume de transactions actuel s’élève à 857.47K, contre un volume quotidien moyen de 998.63K. Cela indique que l’activité de négociation est à peu près conforme à son niveau habituel que d’habitude.
Au cours de l’année écoulée, l’action Solana ETF s’est négociée entre 6.17 et 21.32. Au cours actuel, SOLZ se situe 65.96% au-dessus de son plus bas sur 52 semaines et 51.97% en dessous de son plus haut sur 52 semaines.
SOLZ Actualités liées
À propos SOLZ
Nom l'entreprise
Solana ETF
Secteur
Miscellaneous
Industrie
Investment Trusts/Mutual Funds
Exchanges
Nasdaq
Nombre d’employés
--
Taille du lot
100
Site officiel
--
Devise
USD
Solana ETF (SOLZ) is an exchange-traded product designed to provide direct exposure to Solana by holding SOL. Its value primarily follows the market price of SOL, less operating expenses.
Questions fréquentes sur SOLZ

© 2026 CoinGlass, all rights reserved