TMUSI Estadísticas clave
Alto
20.42
Abrir
20.42
Volumen
10.29K
Bajo
20.30
Cierre anterior
20.39
Valor negociado
209.59K
Máx. 52 sem.
24.80
Volumen rel.
0.21
Amplitud (%)
0.59%
Mín. 52 sem.
20.15
Tasa de rotación
--
Cap. de Mercado
--
PER (TTM)
--
PER (Anual)
18.175
P/B
3.38
P/S
2.06
Beneficio por acción (BPA)
--
Dividendo (TTM)
4.04
Rentabilidad por dividendo
--
Acciones en circulación
--
Moneda
USD
TMUSI Rendimiento del Precio
7 día

30 día

90 día

180 día

En lo que va del año
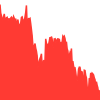
1 Año

TMUSI Distribución del flujo de dinero
TMUSI Volumen diario de ventas en corto
TMUSI Historial de short interest
Resumen de la acción TMUSI
As of 2026-07-28, the T-Mobile US, Inc. 5.500% Senior Notes due June 2070 (TMUSI) stock price today is 20.375. Based on this price, the company has a market capitalization of --, with a P/E ratio of --.
On 2026-07-28, TMUSI traded between 20.30 and 20.42. Today’s stock price is 0.37% above the daily low and 0.22% below the daily high, placing TMUSI dentro del rango superior de its most recent trading range.
Trading volume currently stands at 10.29K, compared with an average daily volume of 49.08K. This suggests that trading activity is significativamente por debajo de su nivel habitual than usual.
Over the past year, T-Mobile US, Inc. 5.500% Senior Notes due June 2070 shares have traded between 20.15 and 24.80. At today’s price, TMUSI is 1.12% above its 52-week low and 17.84% below its 52-week high.
TMUSI Noticias relacionadas
Acerca de TMUSI
Nombre empresa
T-Mobile US, Inc. 5.500% Senior Notes due June 2070
Sector
--
Industria
--
Intercambios
Nasdaq
Número de empleados
--
Tamaño del lote
100
Sitio oficial
--
Moneda
USD
--
Related Stocks
Preguntas frecuentes sobre TMUSI
1. ¿Cuál es hoy el precio en tiempo real de la acción de T-Mobile US, Inc. 5.500% Senior Notes due June 2070 (TMUSI)?
A las 2026-07-27 20:00 (UTC+0), la acción de T-Mobile US, Inc. 5.500% Senior Notes due June 2070 (TMUSI) cotiza a $20.38, Down $0.02 (-0.10%) respecto al precio de cierre de $20.39 de la sesión anterior.
3. ¿Cuál es el precio más reciente de TMUSI en el premercado?
A las Invalid Date (UTC+0), el precio de TMUSI en el premercado era de --.
5. ¿Cómo se ha comportado recientemente el precio de la acción de TMUSI?
A fecha de 2026-07-28 10:02 (UTC+0), TMUSI registró Down de NaN% en los últimos 7 días, Down de NaN% en los últimos 30 días, Down de NaN% desde comienzos de año y Down de NaN% durante el último año.\n\nEl rendimiento histórico del precio refleja únicamente las subidas y bajadas pasadas y no es indicativo de resultados futuros.
7. ¿Cómo es el flujo de capital actual de TMUSI?
A fecha de 2026-07-28 10:02 (UTC+0), TMUSI registró una outflow neta de capital de $NaN. De este importe, la inflow neta de órdenes grandes fue de $0, la inflow neta de órdenes medianas fue de $0 y la outflow neta de órdenes pequeñas fue de $0.
Una entrada neta de capital positiva generalmente indica que la actividad de compra superó a la de venta, mientras que un valor negativo indica una actividad de venta relativamente mayor. Los flujos de capital pueden seguir cambiando a medida que avanza la negociación en el mercado.
9. ¿Cuál es el precio actual de los contratos perpetuos sobre las acciones de TMUSI?
A fecha de 2026-07-28 10:02 (UTC+0), el precio en tiempo real de los contratos perpetuos sobre las acciones de TMUSI es de --, con una variación de 24 horas de --.
El interés abierto total de los contratos perpetuos sobre las acciones de TMUSI se sitúa actualmente en --, con un volumen de negociación de 24 horas de -- y una tasa de financiación ponderada por el interés abierto de --.
Los contratos perpetuos sobre acciones son ofrecidos por plataformas de negociación de criptomonedas y son productos de negociación diferentes de las acciones cotizadas en bolsas de valores. Sus precios, liquidez y horarios de negociación pueden variar.
La página de contratos perpetuos sobre acciones de CoinGlass ofrece actualmente precios en tiempo real, tasas de financiación, interés abierto, volumen de negociación, liquidaciones, ratios largo/corto y datos de mercado de diferentes plataformas.
11. ¿Cuál es la capitalización bursátil de T-Mobile US, Inc. 5.500% Senior Notes due June 2070?
A fecha de 2026-07-28 10:02 (UTC+0), la capitalización bursátil de T-Mobile US, Inc. 5.500% Senior Notes due June 2070 es de aproximadamente --. La capitalización bursátil se calcula en función del precio actual de la acción y del número total de acciones en circulación de la empresa, y puede fluctuar conforme cambia el precio de la acción.
13. ¿Cuál es el beneficio por acción (BPA) de T-Mobile US, Inc. 5.500% Senior Notes due June 2070?
Según los datos de los últimos doce meses, el beneficio por acción de T-Mobile US, Inc. 5.500% Senior Notes due June 2070, o EPS (TTM), es de --. El EPS mide la parte de los beneficios de una empresa atribuible a cada acción ordinaria en circulación.
15. ¿T-Mobile US, Inc. 5.500% Senior Notes due June 2070 paga dividendos?
Durante los últimos doce meses, T-Mobile US, Inc. 5.500% Senior Notes due June 2070 pagó dividendos de 4.040 por acción. Según el precio actual de la acción, la rentabilidad por dividendo es de aproximadamente --. Los importes y las fechas de pago de futuros dividendos pueden cambiar.
17. ¿Cuántos empleados tiene T-Mobile US, Inc. 5.500% Senior Notes due June 2070?
Según los datos empresariales más recientes disponibles, T-Mobile US, Inc. 5.500% Senior Notes due June 2070 contaba con aproximadamente -- empleados a fecha de 2026-07-28. El número de empleados puede variar debido a cambios en la plantilla, la fecha de referencia y diferencias en los criterios de divulgación.
2. ¿Cuáles fueron el rango de cotización y el volumen de negociación de TMUSI en la sesión bursátil más reciente?
En la sesión bursátil más reciente (2026-07-27 20:00 (UTC+0)), TMUSI abrió en $20.42, alcanzó un máximo de $20.42 y registró un mínimo de $20.30. El volumen de negociación de la jornada fue de 10.29K, con un valor total negociado de $209.60K.
El volumen de negociación de esa sesión equivalió a 0.21 veces el volumen medio diario.
4. ¿Cuál es el precio de TMUSI en el mercado poscierre?
A las Invalid Date (UTC+0), el precio de TMUSI en operaciones fuera de horario era de --.
6. ¿Cuáles son el máximo y el mínimo de 52 semanas de TMUSI?
Durante las últimas 52 semanas, TMUSI cotizó entre $20.15 y $24.80. Según el precio actual, TMUSI se encuentra 1.12% por encima de su mínimo de 52 semanas y 17.84% por debajo de su máximo de 52 semanas.
8. ¿Cuáles son el volumen de ventas en corto y las posiciones cortas abiertas de TMUSI?
El undefined, TMUSI registró un volumen de ventas en corto de -- acciones, con un ratio de ventas en corto de -- y un ratio de ventas en corto del Nasdaq de --.
A fecha de --, TMUSI tenía -- acciones en posiciones cortas abiertas, un volumen medio diario de negociación de -- acciones y días para cubrirlas.
El volumen de ventas en corto refleja las operaciones de venta en corto realizadas en un día determinado, mientras que las posiciones cortas abiertas reflejan las posiciones que aún no se han cerrado.
10. ¿Cuáles son la relación precio-beneficio (PER) y los indicadores de valoración de T-Mobile US, Inc. 5.500% Senior Notes due June 2070?
A fecha de 2026-07-28 10:02 (UTC+0), la relación precio-beneficio de los últimos 12 meses de T-Mobile US, Inc. 5.500% Senior Notes due June 2070, o P/E (TTM), es de --. Su P/E anual es de 18.18, su relación precio-valor contable es de 3.38 y su relación precio-ventas es de 2.06.
Estos indicadores de valoración reflejan la relación entre el precio de mercado de las acciones de una empresa y sus beneficios, activos netos e ingresos. Los niveles de valoración considerados razonables pueden variar significativamente entre empresas y sectores.
12. ¿Cuáles fueron los ingresos y el beneficio neto de T-Mobile US, Inc. 5.500% Senior Notes due June 2070 en el trimestre más reciente?
En el trimestre más reciente, T-Mobile US, Inc. 5.500% Senior Notes due June 2070 registró ingresos de -- y un beneficio neto de --. Los ingresos -- un -- interanual, mientras que el beneficio neto -- un -- interanual.
14. ¿Cuál es el número total de acciones en circulación de T-Mobile US, Inc. 5.500% Senior Notes due June 2070?
T-Mobile US, Inc. 5.500% Senior Notes due June 2070 tiene un total de -- acciones en circulación. El total de acciones en circulación se refiere al número total de acciones emitidas por la empresa y mantenidas por los inversores.
16. ¿En qué bolsa cotiza T-Mobile US, Inc. 5.500% Senior Notes due June 2070 y a qué sector e industria pertenece?
T-Mobile US, Inc. 5.500% Senior Notes due June 2070 (TMUSI) cotiza en Nasdaq y pertenece al sector -- y a la industria --.
Las clasificaciones por sector e industria ayudan a los inversores a comprender la principal área de actividad de la empresa y a compararla con otras empresas cotizadas de la misma industria.
18. ¿Qué riesgos deben considerar los inversores antes de invertir en TMUSI?
Antes de invertir en TMUSI, los inversores deben considerar los cambios en los ingresos y la rentabilidad de T-Mobile US, Inc. 5.500% Senior Notes due June 2070, los niveles de valoración, la competencia del sector, los riesgos operativos, el entorno macroeconómico y la volatilidad del precio de la acción. Las previsiones de los analistas y los indicadores técnicos pueden cambiar y no deben utilizarse como única base para tomar decisiones de inversión.
1. ¿Cuál es hoy el precio en tiempo real de la acción de T-Mobile US, Inc. 5.500% Senior Notes due June 2070 (TMUSI)?
A las 2026-07-27 20:00 (UTC+0), la acción de T-Mobile US, Inc. 5.500% Senior Notes due June 2070 (TMUSI) cotiza a $20.38, Down $0.02 (-0.10%) respecto al precio de cierre de $20.39 de la sesión anterior.
2. ¿Cuáles fueron el rango de cotización y el volumen de negociación de TMUSI en la sesión bursátil más reciente?
En la sesión bursátil más reciente (2026-07-27 20:00 (UTC+0)), TMUSI abrió en $20.42, alcanzó un máximo de $20.42 y registró un mínimo de $20.30. El volumen de negociación de la jornada fue de 10.29K, con un valor total negociado de $209.60K.
El volumen de negociación de esa sesión equivalió a 0.21 veces el volumen medio diario.
3. ¿Cuál es el precio más reciente de TMUSI en el premercado?
A las Invalid Date (UTC+0), el precio de TMUSI en el premercado era de --.
4. ¿Cuál es el precio de TMUSI en el mercado poscierre?
A las Invalid Date (UTC+0), el precio de TMUSI en operaciones fuera de horario era de --.
5. ¿Cómo se ha comportado recientemente el precio de la acción de TMUSI?
A fecha de 2026-07-28 10:02 (UTC+0), TMUSI registró Down de NaN% en los últimos 7 días, Down de NaN% en los últimos 30 días, Down de NaN% desde comienzos de año y Down de NaN% durante el último año.\n\nEl rendimiento histórico del precio refleja únicamente las subidas y bajadas pasadas y no es indicativo de resultados futuros.
6. ¿Cuáles son el máximo y el mínimo de 52 semanas de TMUSI?
Durante las últimas 52 semanas, TMUSI cotizó entre $20.15 y $24.80. Según el precio actual, TMUSI se encuentra 1.12% por encima de su mínimo de 52 semanas y 17.84% por debajo de su máximo de 52 semanas.
7. ¿Cómo es el flujo de capital actual de TMUSI?
A fecha de 2026-07-28 10:02 (UTC+0), TMUSI registró una outflow neta de capital de $NaN. De este importe, la inflow neta de órdenes grandes fue de $0, la inflow neta de órdenes medianas fue de $0 y la outflow neta de órdenes pequeñas fue de $0.
Una entrada neta de capital positiva generalmente indica que la actividad de compra superó a la de venta, mientras que un valor negativo indica una actividad de venta relativamente mayor. Los flujos de capital pueden seguir cambiando a medida que avanza la negociación en el mercado.
8. ¿Cuáles son el volumen de ventas en corto y las posiciones cortas abiertas de TMUSI?
El undefined, TMUSI registró un volumen de ventas en corto de -- acciones, con un ratio de ventas en corto de -- y un ratio de ventas en corto del Nasdaq de --.
A fecha de --, TMUSI tenía -- acciones en posiciones cortas abiertas, un volumen medio diario de negociación de -- acciones y días para cubrirlas.
El volumen de ventas en corto refleja las operaciones de venta en corto realizadas en un día determinado, mientras que las posiciones cortas abiertas reflejan las posiciones que aún no se han cerrado.
9. ¿Cuál es el precio actual de los contratos perpetuos sobre las acciones de TMUSI?
A fecha de 2026-07-28 10:02 (UTC+0), el precio en tiempo real de los contratos perpetuos sobre las acciones de TMUSI es de --, con una variación de 24 horas de --.
El interés abierto total de los contratos perpetuos sobre las acciones de TMUSI se sitúa actualmente en --, con un volumen de negociación de 24 horas de -- y una tasa de financiación ponderada por el interés abierto de --.
Los contratos perpetuos sobre acciones son ofrecidos por plataformas de negociación de criptomonedas y son productos de negociación diferentes de las acciones cotizadas en bolsas de valores. Sus precios, liquidez y horarios de negociación pueden variar.
La página de contratos perpetuos sobre acciones de CoinGlass ofrece actualmente precios en tiempo real, tasas de financiación, interés abierto, volumen de negociación, liquidaciones, ratios largo/corto y datos de mercado de diferentes plataformas.
10. ¿Cuáles son la relación precio-beneficio (PER) y los indicadores de valoración de T-Mobile US, Inc. 5.500% Senior Notes due June 2070?
A fecha de 2026-07-28 10:02 (UTC+0), la relación precio-beneficio de los últimos 12 meses de T-Mobile US, Inc. 5.500% Senior Notes due June 2070, o P/E (TTM), es de --. Su P/E anual es de 18.18, su relación precio-valor contable es de 3.38 y su relación precio-ventas es de 2.06.
Estos indicadores de valoración reflejan la relación entre el precio de mercado de las acciones de una empresa y sus beneficios, activos netos e ingresos. Los niveles de valoración considerados razonables pueden variar significativamente entre empresas y sectores.
11. ¿Cuál es la capitalización bursátil de T-Mobile US, Inc. 5.500% Senior Notes due June 2070?
A fecha de 2026-07-28 10:02 (UTC+0), la capitalización bursátil de T-Mobile US, Inc. 5.500% Senior Notes due June 2070 es de aproximadamente --. La capitalización bursátil se calcula en función del precio actual de la acción y del número total de acciones en circulación de la empresa, y puede fluctuar conforme cambia el precio de la acción.
12. ¿Cuáles fueron los ingresos y el beneficio neto de T-Mobile US, Inc. 5.500% Senior Notes due June 2070 en el trimestre más reciente?
En el trimestre más reciente, T-Mobile US, Inc. 5.500% Senior Notes due June 2070 registró ingresos de -- y un beneficio neto de --. Los ingresos -- un -- interanual, mientras que el beneficio neto -- un -- interanual.
13. ¿Cuál es el beneficio por acción (BPA) de T-Mobile US, Inc. 5.500% Senior Notes due June 2070?
Según los datos de los últimos doce meses, el beneficio por acción de T-Mobile US, Inc. 5.500% Senior Notes due June 2070, o EPS (TTM), es de --. El EPS mide la parte de los beneficios de una empresa atribuible a cada acción ordinaria en circulación.
14. ¿Cuál es el número total de acciones en circulación de T-Mobile US, Inc. 5.500% Senior Notes due June 2070?
T-Mobile US, Inc. 5.500% Senior Notes due June 2070 tiene un total de -- acciones en circulación. El total de acciones en circulación se refiere al número total de acciones emitidas por la empresa y mantenidas por los inversores.
15. ¿T-Mobile US, Inc. 5.500% Senior Notes due June 2070 paga dividendos?
Durante los últimos doce meses, T-Mobile US, Inc. 5.500% Senior Notes due June 2070 pagó dividendos de 4.040 por acción. Según el precio actual de la acción, la rentabilidad por dividendo es de aproximadamente --. Los importes y las fechas de pago de futuros dividendos pueden cambiar.
16. ¿En qué bolsa cotiza T-Mobile US, Inc. 5.500% Senior Notes due June 2070 y a qué sector e industria pertenece?
T-Mobile US, Inc. 5.500% Senior Notes due June 2070 (TMUSI) cotiza en Nasdaq y pertenece al sector -- y a la industria --.
Las clasificaciones por sector e industria ayudan a los inversores a comprender la principal área de actividad de la empresa y a compararla con otras empresas cotizadas de la misma industria.
17. ¿Cuántos empleados tiene T-Mobile US, Inc. 5.500% Senior Notes due June 2070?
Según los datos empresariales más recientes disponibles, T-Mobile US, Inc. 5.500% Senior Notes due June 2070 contaba con aproximadamente -- empleados a fecha de 2026-07-28. El número de empleados puede variar debido a cambios en la plantilla, la fecha de referencia y diferencias en los criterios de divulgación.
18. ¿Qué riesgos deben considerar los inversores antes de invertir en TMUSI?
Antes de invertir en TMUSI, los inversores deben considerar los cambios en los ingresos y la rentabilidad de T-Mobile US, Inc. 5.500% Senior Notes due June 2070, los niveles de valoración, la competencia del sector, los riesgos operativos, el entorno macroeconómico y la volatilidad del precio de la acción. Las previsiones de los analistas y los indicadores técnicos pueden cambiar y no deben utilizarse como única base para tomar decisiones de inversión.

© 2026 CoinGlass, all rights reserved