TMUSI Wichtige Statistiken
Hoch
20.42
Öffnen
20.42
Volumen
10.29K
Niedrig
20.30
Vorheriger Schlusskurs
20.39
Handelswert
209.59K
52W-Hoch
24.80
Rel. Volumen
0.21
Amplitude (%)
0.59%
52W-Tief
20.15
Umsatzrate
--
Marktkapitalisierung
--
KGV (TTM)
--
KGV (Jährlich)
18.175
KBV
3.38
KUV
2.06
Gewinn je Aktie (EPS)
--
Dividende (TTM)
4.04
Dividendenrendite
--
Ausstehende Aktien
--
Währung
USD
TMUSI Preis-Performance
7 Tag

30 Tag

90 Tag

180 Tag

Seit Jahresbeginn
1 Jahr
TMUSI Moneyflow-Verteilung
TMUSI Tägliches Leerverkaufsvolumen
TMUSI Short-Interest-Historie
TMUSI Aktien-Snapshot
As of 2026-07-28, the T-Mobile US, Inc. 5.500% Senior Notes due June 2070 (TMUSI) stock price today is 20.375. Based on this price, the company has a market capitalization of --, with a P/E ratio of --.
On 2026-07-28, TMUSI traded between 20.30 and 20.42. Today’s stock price is 0.37% above the daily low and 0.22% below the daily high, placing TMUSI im oberen Bereich von its most recent trading range.
Trading volume currently stands at 10.29K, compared with an average daily volume of 49.08K. This suggests that trading activity is deutlich unter dem üblichen Niveau than usual.
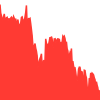
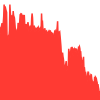
Over the past year, T-Mobile US, Inc. 5.500% Senior Notes due June 2070 shares have traded between 20.15 and 24.80. At today’s price, TMUSI is 1.12% above its 52-week low and 17.84% below its 52-week high.
TMUSI Verwandte Nachrichten
Über TMUSI
Firmenname
T-Mobile US, Inc. 5.500% Senior Notes due June 2070
Sektor
--
Branche
--
Börsen
Nasdaq
Anzahl der Beschäftigten
--
Losgröße
100
Offizielle Website
--
Währung
USD
--
Related Stocks
Häufig gestellte Fragen zu TMUSI
1. Wie hoch ist heute der Echtzeitkurs der Aktie von T-Mobile US, Inc. 5.500% Senior Notes due June 2070 (TMUSI)?
Mit Stand 2026-07-27 20:00 (UTC+0) notiert die Aktie von T-Mobile US, Inc. 5.500% Senior Notes due June 2070 (TMUSI) bei $20.38, Down $0.02 (-0.10%) gegenüber dem Schlusskurs von $20.39 am vorherigen Handelstag.
3. Wie hoch ist der aktuelle vorbörsliche Kurs von TMUSI?
Um Invalid Date (UTC+0) lag der vorbörsliche Kurs von TMUSI bei --.
5. Wie hat sich der Aktienkurs von TMUSI in letzter Zeit entwickelt?
Mit Stand 2026-07-28 10:03 (UTC+0) ist TMUSI in den vergangenen 7 Tagen um NaN% Down, in den vergangenen 30 Tagen um NaN% Down, seit Jahresbeginn um NaN% Down und im vergangenen Jahr um NaN% Down.\n\nDie historische Kursentwicklung spiegelt ausschließlich vergangene Kursgewinne und -verluste wider und ist kein Indikator für die zukünftige Entwicklung.
7. Wie sieht der aktuelle Kapitalfluss bei TMUSI aus?
Mit Stand 2026-07-28 10:03 (UTC+0) verzeichnete TMUSI einen Netto-Kapitaloutflow von $NaN. Davon belief sich der Netto-inflow bei Großorders auf $0, der Netto-inflow bei mittelgroßen Orders auf $0 und der Netto-outflow bei Kleinorders auf $0.
Ein positiver Netto-Kapitalzufluss deutet in der Regel darauf hin, dass die Kaufaktivität die Verkaufsaktivität überstieg. Ein negativer Wert weist dagegen auf eine relativ höhere Verkaufsaktivität hin. Die Kapitalströme können sich im weiteren Handelsverlauf fortlaufend verändern.
9. Wie hoch ist der aktuelle Preis der unbefristeten Aktienkontrakte auf TMUSI?
Mit Stand 2026-07-28 10:03 (UTC+0) liegt der Echtzeitpreis der unbefristeten Aktienkontrakte auf TMUSI bei --, bei einer 24-Stunden-Veränderung von --.
Das gesamte Open Interest der unbefristeten Aktienkontrakte auf TMUSI beträgt derzeit --, bei einem 24-Stunden-Handelsvolumen von -- und einer nach Open Interest gewichteten Funding Rate von --.
Unbefristete Aktienkontrakte werden von Kryptohandelsplattformen angeboten und sind andere Handelsprodukte als Aktien, die an Wertpapierbörsen notiert sind. Ihre Preise, Liquidität und Handelszeiten können voneinander abweichen.
Die CoinGlass-Seite für unbefristete Aktienkontrakte bietet derzeit Echtzeitpreise, Funding Rates, Open Interest, Handelsvolumen, Liquidationen, Long/Short-Verhältnisse und Marktdaten verschiedener Börsen.
11. Wie hoch ist die Marktkapitalisierung von T-Mobile US, Inc. 5.500% Senior Notes due June 2070?
Mit Stand 2026-07-28 10:03 (UTC+0) beträgt die Marktkapitalisierung von T-Mobile US, Inc. 5.500% Senior Notes due June 2070 rund --. Die Marktkapitalisierung wird auf Grundlage des aktuellen Aktienkurses und der Gesamtzahl der ausstehenden Aktien des Unternehmens berechnet und kann mit Veränderungen des Aktienkurses schwanken.
13. Wie hoch ist der Gewinn je Aktie (EPS) von T-Mobile US, Inc. 5.500% Senior Notes due June 2070?
Auf Grundlage der Daten der letzten zwölf Monate beträgt der Gewinn je Aktie von T-Mobile US, Inc. 5.500% Senior Notes due June 2070, also das EPS (TTM), --. Das EPS gibt an, welcher Anteil des Unternehmensgewinns auf jede ausstehende Stammaktie entfällt.
15. Zahlt T-Mobile US, Inc. 5.500% Senior Notes due June 2070 Dividenden?
In den vergangenen zwölf Monaten schüttete T-Mobile US, Inc. 5.500% Senior Notes due June 2070 eine Dividende von 4.040 je Aktie aus. Auf Basis des aktuellen Aktienkurses beträgt die Dividendenrendite rund --. Künftige Dividendenbeträge und Auszahlungstermine können sich ändern.
17. Wie viele Mitarbeiter hat T-Mobile US, Inc. 5.500% Senior Notes due June 2070?
Nach den neuesten verfügbaren Unternehmensdaten beschäftigte T-Mobile US, Inc. 5.500% Senior Notes due June 2070 zum 2026-07-28 rund -- Mitarbeiter. Die Mitarbeiterzahl kann sich aufgrund personeller Veränderungen, des Berichtszeitpunkts und unterschiedlicher Offenlegungsmethoden ändern.
2. Wie groß waren die Handelsspanne und das Handelsvolumen von TMUSI am letzten Handelstag?
Am letzten Handelstag (2026-07-27 20:00 (UTC+0)) eröffnete TMUSI bei $20.42, erreichte ein Tageshoch von $20.42 und ein Tagestief von $20.30. Das Handelsvolumen belief sich auf 10.29K, bei einem gesamten Handelswert von $209.60K.
Das Handelsvolumen an diesem Tag war 0.21-mal so hoch wie das durchschnittliche tägliche Handelsvolumen.
4. Wie hoch ist der nachbörsliche Kurs von TMUSI?
Um Invalid Date (UTC+0) lag der nachbörsliche Kurs von TMUSI bei --.
6. Wie hoch sind das 52-Wochen-Hoch und das 52-Wochen-Tief von TMUSI?
In den vergangenen 52 Wochen wurde TMUSI zwischen $20.15 und $24.80 gehandelt. Auf Basis des aktuellen Kurses liegt TMUSI 1.12% über seinem 52-Wochen-Tief und 17.84% unter seinem 52-Wochen-Hoch.
8. Wie hoch sind das Leerverkaufsvolumen und die ausstehenden Short-Positionen von TMUSI?
Am undefined belief sich das Leerverkaufsvolumen von TMUSI auf -- Aktien, bei einer Leerverkaufsquote von -- und einer Nasdaq-Leerverkaufsquote von --.
Mit Stand -- beliefen sich die ausstehenden Short-Positionen von TMUSI auf -- Aktien, das durchschnittliche tägliche Handelsvolumen auf -- Aktien und die Eindeckungsdauer auf Tage.
Das Leerverkaufsvolumen bildet die Leerverkaufstransaktionen eines bestimmten Tages ab, während die ausstehenden Short-Positionen noch nicht geschlossene Positionen darstellen.
10. Wie hoch sind das Kurs-Gewinn-Verhältnis und die Bewertungskennzahlen von T-Mobile US, Inc. 5.500% Senior Notes due June 2070?
Mit Stand 2026-07-28 10:03 (UTC+0) beträgt das Kurs-Gewinn-Verhältnis von T-Mobile US, Inc. 5.500% Senior Notes due June 2070 auf Basis der letzten zwölf Monate, also das P/E (TTM), --. Das jährliche KGV liegt bei 18.18, das Kurs-Buchwert-Verhältnis bei 3.38 und das Kurs-Umsatz-Verhältnis bei 2.06.
Diese Bewertungskennzahlen spiegeln das Verhältnis zwischen dem Aktienkurs eines Unternehmens und seinem Gewinn, Nettovermögen und Umsatz wider. Angemessene Bewertungsniveaus können je nach Unternehmen und Branche erheblich variieren.
12. Wie hoch waren der Umsatz und der Nettogewinn von T-Mobile US, Inc. 5.500% Senior Notes due June 2070 im jüngsten Quartal?
Im jüngsten Quartal meldete T-Mobile US, Inc. 5.500% Senior Notes due June 2070 einen Umsatz von -- und einen Nettogewinn von --. Der Umsatz ist im Jahresvergleich um -- --, während der Nettogewinn um -- -- ist.
14. Wie hoch ist die Gesamtzahl der ausstehenden Aktien von T-Mobile US, Inc. 5.500% Senior Notes due June 2070?
T-Mobile US, Inc. 5.500% Senior Notes due June 2070 hat insgesamt -- ausstehende Aktien. Die Gesamtzahl der ausstehenden Aktien bezeichnet alle vom Unternehmen ausgegebenen und von Anlegern gehaltenen Aktien.
16. An welcher Börse ist T-Mobile US, Inc. 5.500% Senior Notes due June 2070 notiert und welchem Sektor sowie welcher Branche gehört das Unternehmen an?
T-Mobile US, Inc. 5.500% Senior Notes due June 2070 (TMUSI) ist an der Nasdaq notiert und gehört zum Sektor -- sowie zur Branche --.
Sektor- und Branchenklassifizierungen helfen Anlegern, das wichtigste Geschäftsfeld des Unternehmens zu verstehen und es mit anderen börsennotierten Unternehmen derselben Branche zu vergleichen.
18. Welche Risiken sollten Anleger vor einer Investition in TMUSI berücksichtigen?
Vor einer Investition in TMUSI sollten Anleger Veränderungen beim Umsatz und bei der Rentabilität von T-Mobile US, Inc. 5.500% Senior Notes due June 2070, das Bewertungsniveau, den Wettbewerb innerhalb der Branche, operative Risiken, das makroökonomische Umfeld und die Volatilität des Aktienkurses berücksichtigen. Analystenprognosen und technische Indikatoren können sich ändern und sollten nicht als alleinige Grundlage für Anlageentscheidungen dienen.
1. Wie hoch ist heute der Echtzeitkurs der Aktie von T-Mobile US, Inc. 5.500% Senior Notes due June 2070 (TMUSI)?
Mit Stand 2026-07-27 20:00 (UTC+0) notiert die Aktie von T-Mobile US, Inc. 5.500% Senior Notes due June 2070 (TMUSI) bei $20.38, Down $0.02 (-0.10%) gegenüber dem Schlusskurs von $20.39 am vorherigen Handelstag.
2. Wie groß waren die Handelsspanne und das Handelsvolumen von TMUSI am letzten Handelstag?
Am letzten Handelstag (2026-07-27 20:00 (UTC+0)) eröffnete TMUSI bei $20.42, erreichte ein Tageshoch von $20.42 und ein Tagestief von $20.30. Das Handelsvolumen belief sich auf 10.29K, bei einem gesamten Handelswert von $209.60K.
Das Handelsvolumen an diesem Tag war 0.21-mal so hoch wie das durchschnittliche tägliche Handelsvolumen.
3. Wie hoch ist der aktuelle vorbörsliche Kurs von TMUSI?
Um Invalid Date (UTC+0) lag der vorbörsliche Kurs von TMUSI bei --.
4. Wie hoch ist der nachbörsliche Kurs von TMUSI?
Um Invalid Date (UTC+0) lag der nachbörsliche Kurs von TMUSI bei --.
5. Wie hat sich der Aktienkurs von TMUSI in letzter Zeit entwickelt?
Mit Stand 2026-07-28 10:03 (UTC+0) ist TMUSI in den vergangenen 7 Tagen um NaN% Down, in den vergangenen 30 Tagen um NaN% Down, seit Jahresbeginn um NaN% Down und im vergangenen Jahr um NaN% Down.\n\nDie historische Kursentwicklung spiegelt ausschließlich vergangene Kursgewinne und -verluste wider und ist kein Indikator für die zukünftige Entwicklung.
6. Wie hoch sind das 52-Wochen-Hoch und das 52-Wochen-Tief von TMUSI?
In den vergangenen 52 Wochen wurde TMUSI zwischen $20.15 und $24.80 gehandelt. Auf Basis des aktuellen Kurses liegt TMUSI 1.12% über seinem 52-Wochen-Tief und 17.84% unter seinem 52-Wochen-Hoch.
7. Wie sieht der aktuelle Kapitalfluss bei TMUSI aus?
Mit Stand 2026-07-28 10:03 (UTC+0) verzeichnete TMUSI einen Netto-Kapitaloutflow von $NaN. Davon belief sich der Netto-inflow bei Großorders auf $0, der Netto-inflow bei mittelgroßen Orders auf $0 und der Netto-outflow bei Kleinorders auf $0.
Ein positiver Netto-Kapitalzufluss deutet in der Regel darauf hin, dass die Kaufaktivität die Verkaufsaktivität überstieg. Ein negativer Wert weist dagegen auf eine relativ höhere Verkaufsaktivität hin. Die Kapitalströme können sich im weiteren Handelsverlauf fortlaufend verändern.
8. Wie hoch sind das Leerverkaufsvolumen und die ausstehenden Short-Positionen von TMUSI?
Am undefined belief sich das Leerverkaufsvolumen von TMUSI auf -- Aktien, bei einer Leerverkaufsquote von -- und einer Nasdaq-Leerverkaufsquote von --.
Mit Stand -- beliefen sich die ausstehenden Short-Positionen von TMUSI auf -- Aktien, das durchschnittliche tägliche Handelsvolumen auf -- Aktien und die Eindeckungsdauer auf Tage.
Das Leerverkaufsvolumen bildet die Leerverkaufstransaktionen eines bestimmten Tages ab, während die ausstehenden Short-Positionen noch nicht geschlossene Positionen darstellen.
9. Wie hoch ist der aktuelle Preis der unbefristeten Aktienkontrakte auf TMUSI?
Mit Stand 2026-07-28 10:03 (UTC+0) liegt der Echtzeitpreis der unbefristeten Aktienkontrakte auf TMUSI bei --, bei einer 24-Stunden-Veränderung von --.
Das gesamte Open Interest der unbefristeten Aktienkontrakte auf TMUSI beträgt derzeit --, bei einem 24-Stunden-Handelsvolumen von -- und einer nach Open Interest gewichteten Funding Rate von --.
Unbefristete Aktienkontrakte werden von Kryptohandelsplattformen angeboten und sind andere Handelsprodukte als Aktien, die an Wertpapierbörsen notiert sind. Ihre Preise, Liquidität und Handelszeiten können voneinander abweichen.
Die CoinGlass-Seite für unbefristete Aktienkontrakte bietet derzeit Echtzeitpreise, Funding Rates, Open Interest, Handelsvolumen, Liquidationen, Long/Short-Verhältnisse und Marktdaten verschiedener Börsen.
10. Wie hoch sind das Kurs-Gewinn-Verhältnis und die Bewertungskennzahlen von T-Mobile US, Inc. 5.500% Senior Notes due June 2070?
Mit Stand 2026-07-28 10:03 (UTC+0) beträgt das Kurs-Gewinn-Verhältnis von T-Mobile US, Inc. 5.500% Senior Notes due June 2070 auf Basis der letzten zwölf Monate, also das P/E (TTM), --. Das jährliche KGV liegt bei 18.18, das Kurs-Buchwert-Verhältnis bei 3.38 und das Kurs-Umsatz-Verhältnis bei 2.06.
Diese Bewertungskennzahlen spiegeln das Verhältnis zwischen dem Aktienkurs eines Unternehmens und seinem Gewinn, Nettovermögen und Umsatz wider. Angemessene Bewertungsniveaus können je nach Unternehmen und Branche erheblich variieren.
11. Wie hoch ist die Marktkapitalisierung von T-Mobile US, Inc. 5.500% Senior Notes due June 2070?
Mit Stand 2026-07-28 10:03 (UTC+0) beträgt die Marktkapitalisierung von T-Mobile US, Inc. 5.500% Senior Notes due June 2070 rund --. Die Marktkapitalisierung wird auf Grundlage des aktuellen Aktienkurses und der Gesamtzahl der ausstehenden Aktien des Unternehmens berechnet und kann mit Veränderungen des Aktienkurses schwanken.
12. Wie hoch waren der Umsatz und der Nettogewinn von T-Mobile US, Inc. 5.500% Senior Notes due June 2070 im jüngsten Quartal?
Im jüngsten Quartal meldete T-Mobile US, Inc. 5.500% Senior Notes due June 2070 einen Umsatz von -- und einen Nettogewinn von --. Der Umsatz ist im Jahresvergleich um -- --, während der Nettogewinn um -- -- ist.
13. Wie hoch ist der Gewinn je Aktie (EPS) von T-Mobile US, Inc. 5.500% Senior Notes due June 2070?
Auf Grundlage der Daten der letzten zwölf Monate beträgt der Gewinn je Aktie von T-Mobile US, Inc. 5.500% Senior Notes due June 2070, also das EPS (TTM), --. Das EPS gibt an, welcher Anteil des Unternehmensgewinns auf jede ausstehende Stammaktie entfällt.
14. Wie hoch ist die Gesamtzahl der ausstehenden Aktien von T-Mobile US, Inc. 5.500% Senior Notes due June 2070?
T-Mobile US, Inc. 5.500% Senior Notes due June 2070 hat insgesamt -- ausstehende Aktien. Die Gesamtzahl der ausstehenden Aktien bezeichnet alle vom Unternehmen ausgegebenen und von Anlegern gehaltenen Aktien.
15. Zahlt T-Mobile US, Inc. 5.500% Senior Notes due June 2070 Dividenden?
In den vergangenen zwölf Monaten schüttete T-Mobile US, Inc. 5.500% Senior Notes due June 2070 eine Dividende von 4.040 je Aktie aus. Auf Basis des aktuellen Aktienkurses beträgt die Dividendenrendite rund --. Künftige Dividendenbeträge und Auszahlungstermine können sich ändern.
16. An welcher Börse ist T-Mobile US, Inc. 5.500% Senior Notes due June 2070 notiert und welchem Sektor sowie welcher Branche gehört das Unternehmen an?
T-Mobile US, Inc. 5.500% Senior Notes due June 2070 (TMUSI) ist an der Nasdaq notiert und gehört zum Sektor -- sowie zur Branche --.
Sektor- und Branchenklassifizierungen helfen Anlegern, das wichtigste Geschäftsfeld des Unternehmens zu verstehen und es mit anderen börsennotierten Unternehmen derselben Branche zu vergleichen.
17. Wie viele Mitarbeiter hat T-Mobile US, Inc. 5.500% Senior Notes due June 2070?
Nach den neuesten verfügbaren Unternehmensdaten beschäftigte T-Mobile US, Inc. 5.500% Senior Notes due June 2070 zum 2026-07-28 rund -- Mitarbeiter. Die Mitarbeiterzahl kann sich aufgrund personeller Veränderungen, des Berichtszeitpunkts und unterschiedlicher Offenlegungsmethoden ändern.
18. Welche Risiken sollten Anleger vor einer Investition in TMUSI berücksichtigen?
Vor einer Investition in TMUSI sollten Anleger Veränderungen beim Umsatz und bei der Rentabilität von T-Mobile US, Inc. 5.500% Senior Notes due June 2070, das Bewertungsniveau, den Wettbewerb innerhalb der Branche, operative Risiken, das makroökonomische Umfeld und die Volatilität des Aktienkurses berücksichtigen. Analystenprognosen und technische Indikatoren können sich ändern und sollten nicht als alleinige Grundlage für Anlageentscheidungen dienen.

© 2026 CoinGlass, all rights reserved