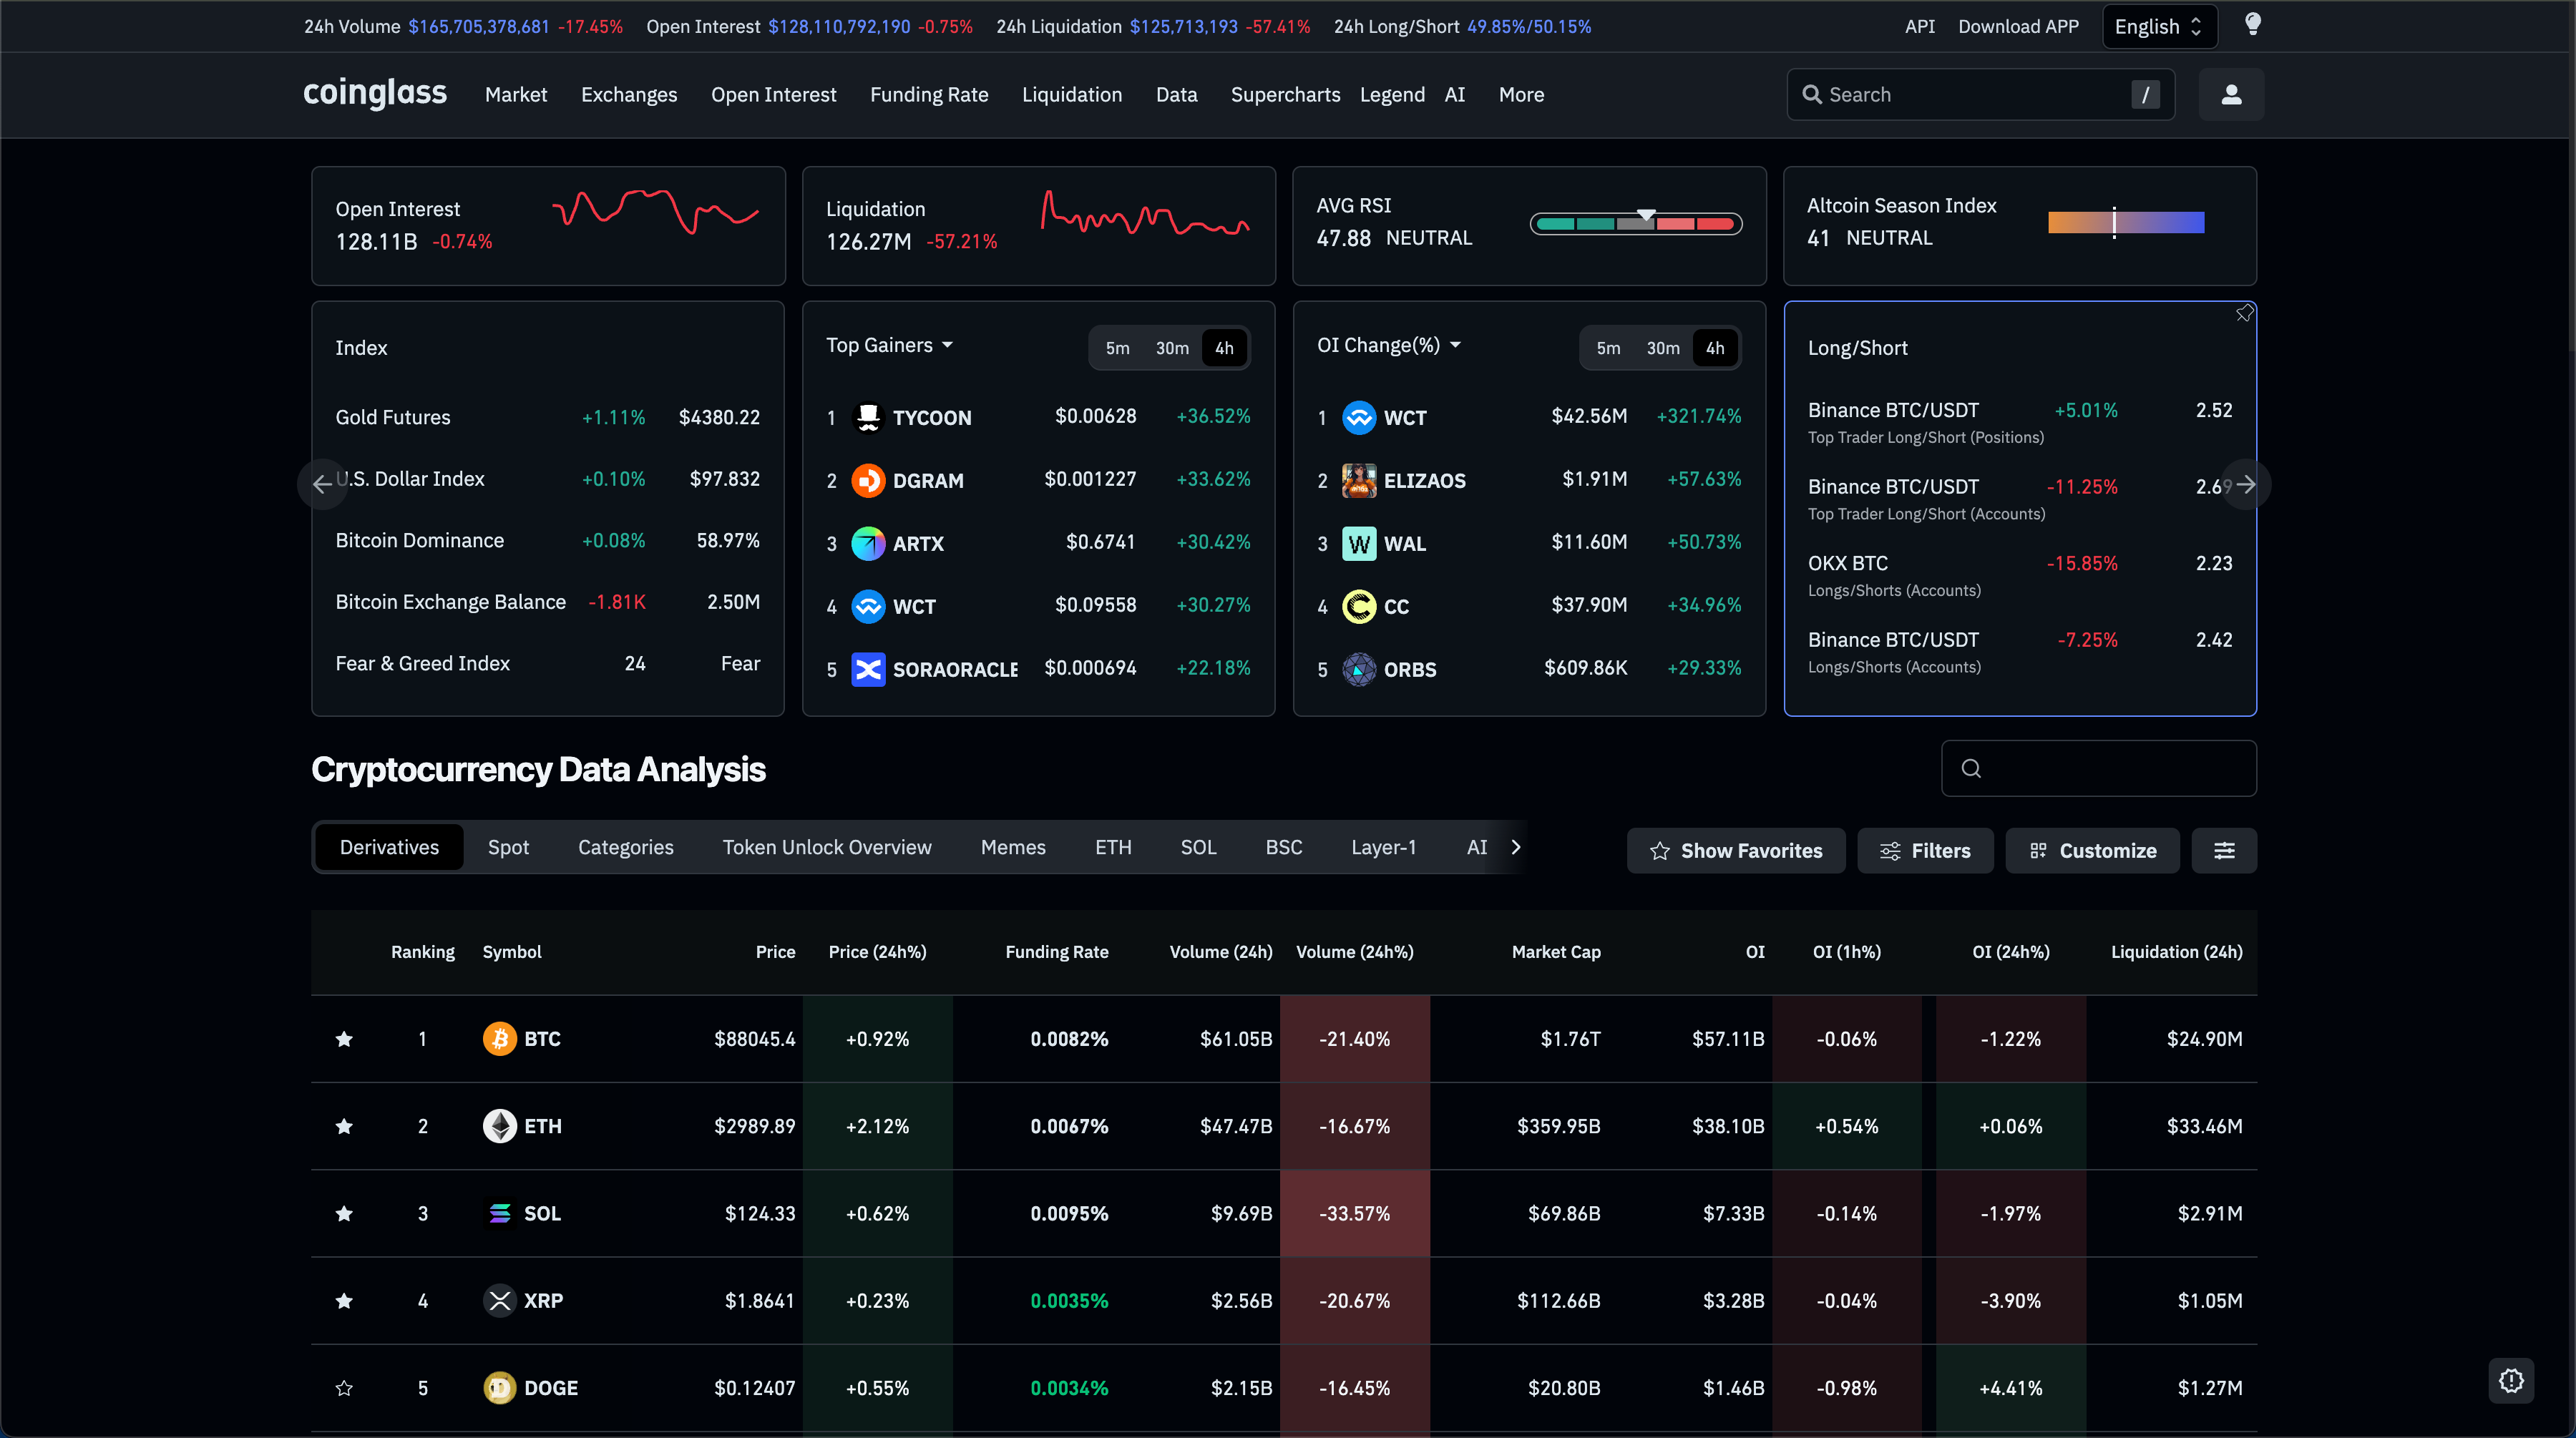
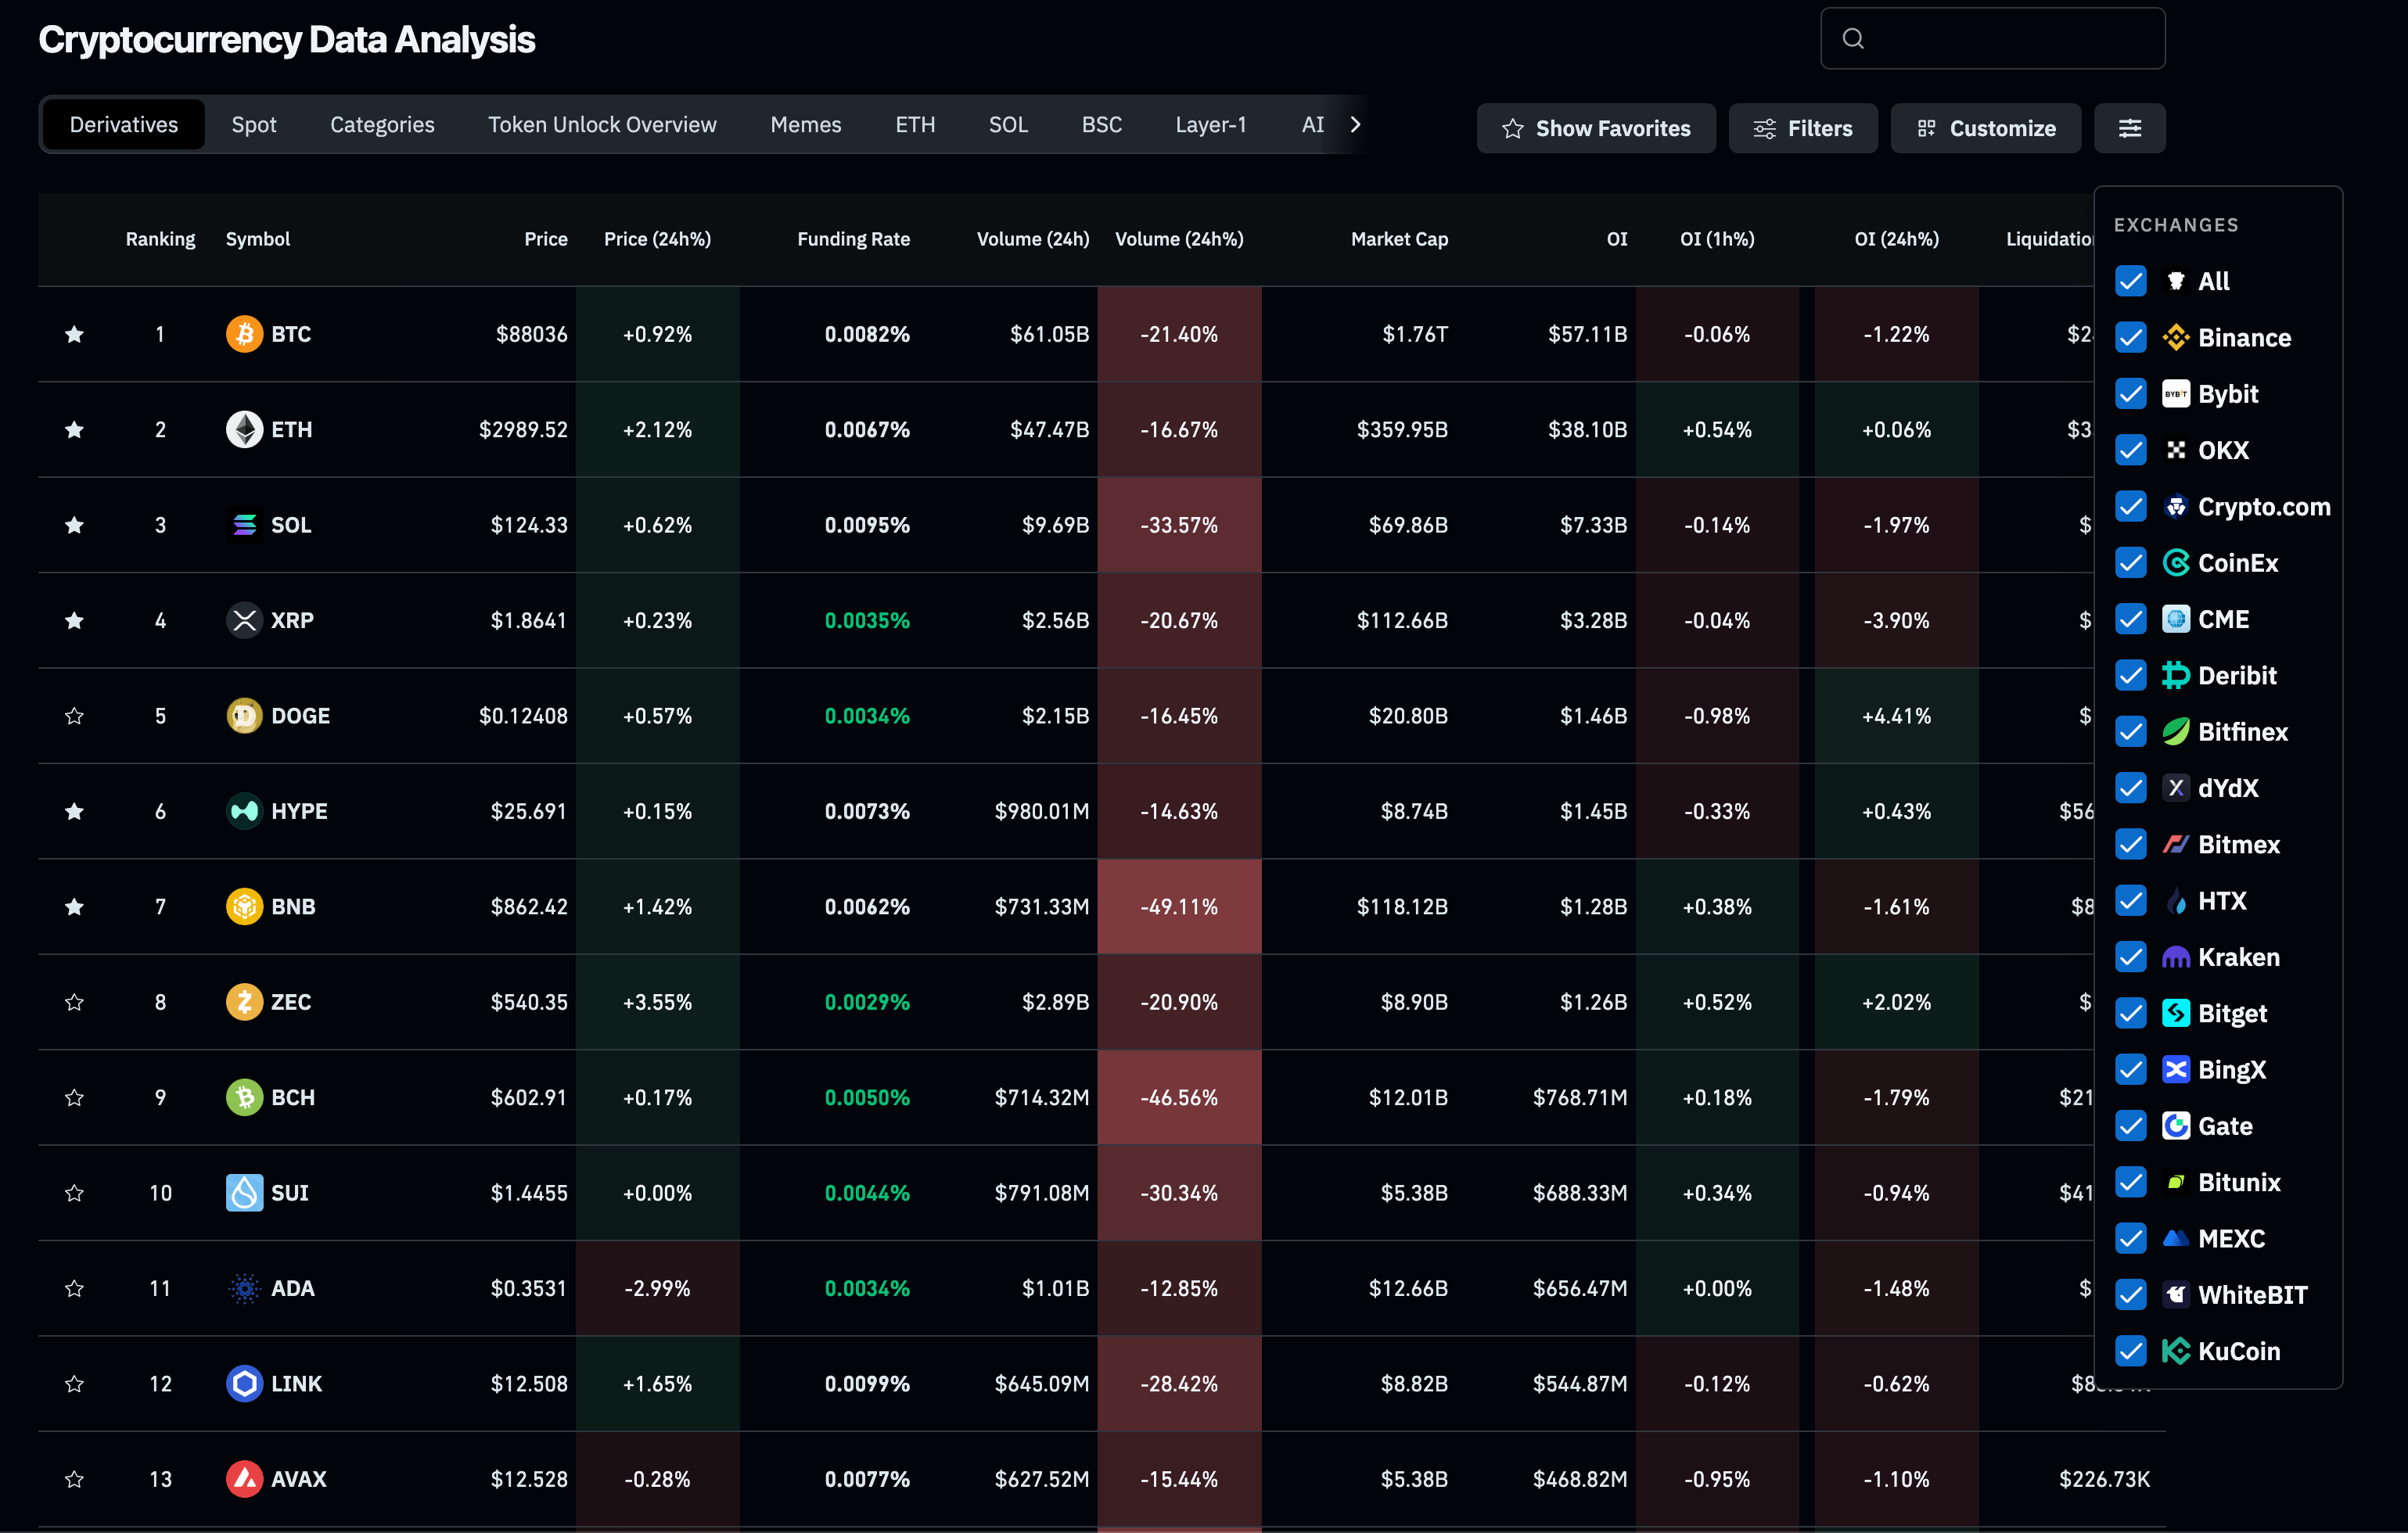
The CoinGlass homepage serves as a comprehensive dashboard for the cryptocurrency derivatives market, providing an immediate overview of current market hotspots and fundamental data at the very top of the interface. To tailor the experience to your specific needs, the platform allows you to prioritize and anchor your preferred data columns by simply clicking the "pin" icon, ensuring your most critical information is always visible. You can further refine the display using the filter function in the top-right corner to isolate content from specific exchanges, although retaining the default "Select All" setting is often recommended for a broader market perspective.
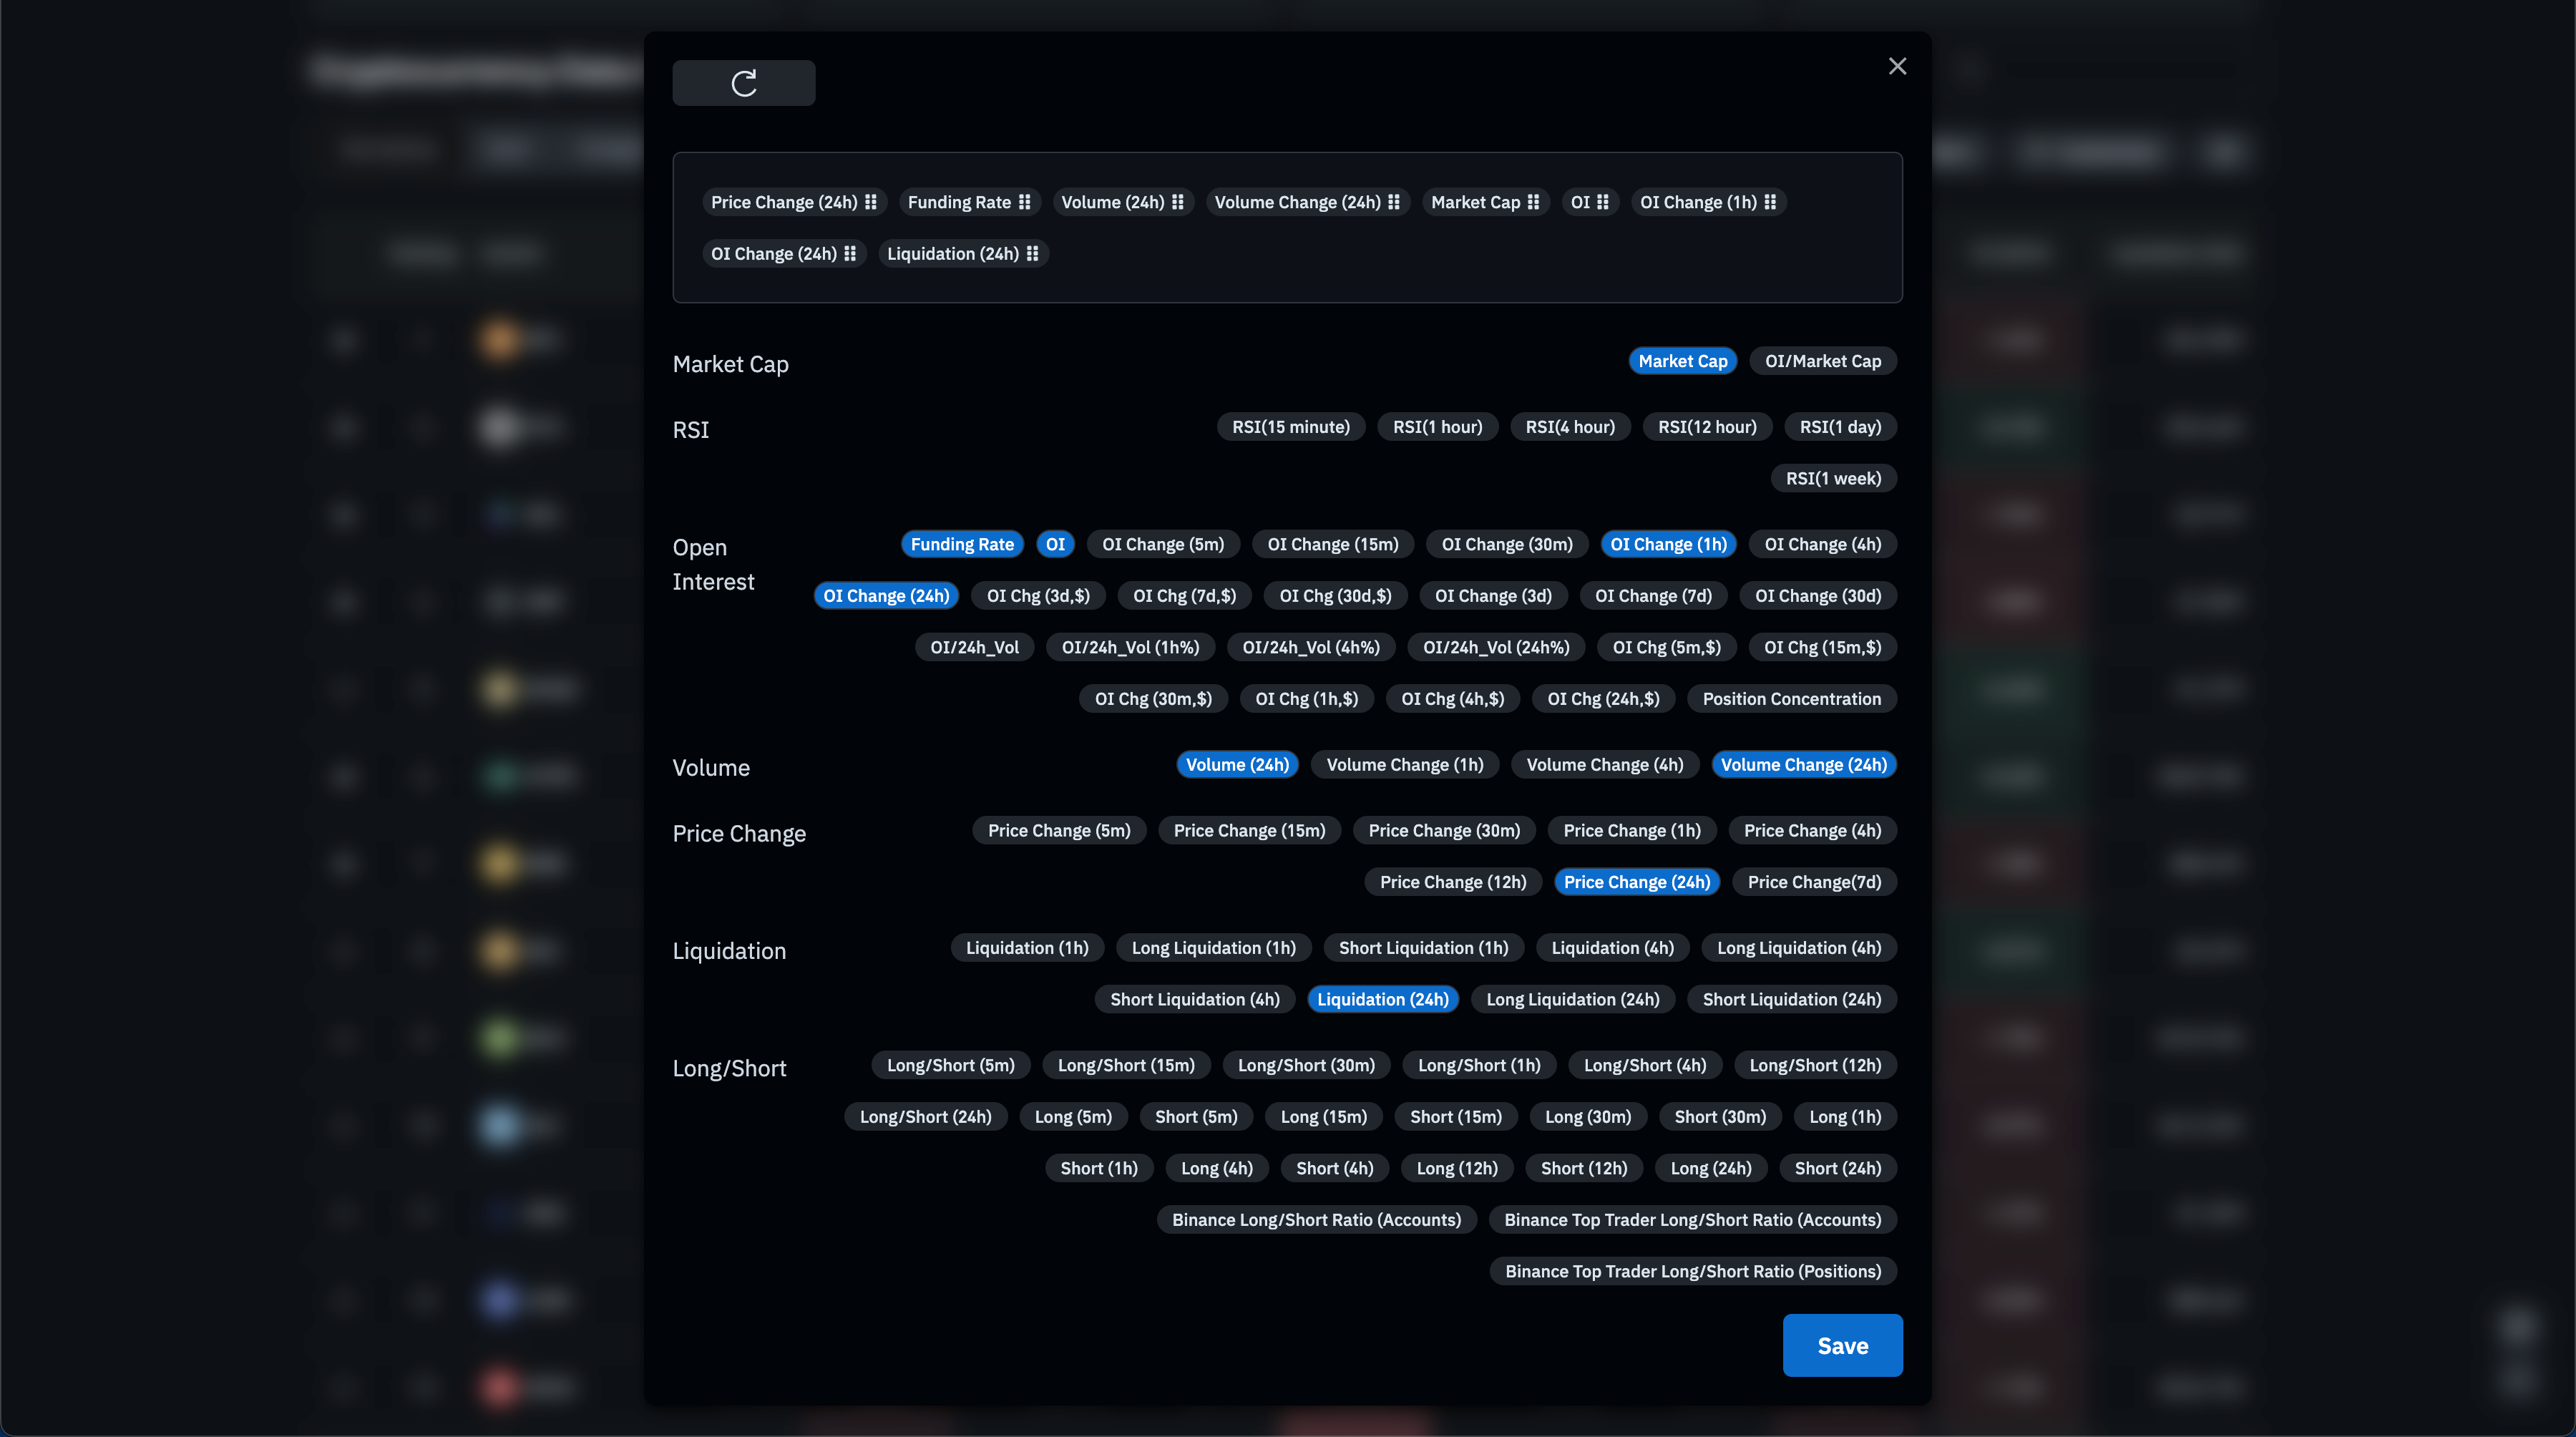
The platform offers extensive customization capabilities, allowing users to configure the dashboard with the indicators they find most valuable. You can personalize the interface to track metrics such as Market Cap, the Open Interest (OI) to Market Cap ratio, Funding Rates, total OI, OI Change, Price Change, Volume, and Liquidation data. CoinGlass is designed to provide maximum flexibility, enabling you to build a custom instrument panel that aligns perfectly with your trading strategy.
Understanding market sentiment requires a grasp of Open Interest (OI) and its relationship with price action. OI represents the total value of active, unsettled contracts in the market at any given moment, while OI Change tracks the fluctuation of this value over specific periods, such as 1 or 24 hours. Analyzing these two metrics together reveals market strength: rising prices accompanied by rising OI suggest a healthy, strong trend driven by new long positions, whereas rising prices with falling OI indicate weakness, often signaling short covering or a false breakout. Conversely, falling prices with rising OI represent a healthy bearish trend where shorts are aggressively opening positions, while falling prices coupled with falling OI suggest the downtrend is losing momentum as longs liquidate, potentially foreshadowing a rebound.
To distinguish between activity and retention, it is important to note that Volume measures the total capital exchanged over a set period (e.g., 24 hours), reflecting market activity, whereas OI indicates the amount of capital remaining in the market. Additionally, the Funding Rate is a critical mechanism in perpetual contracts used to anchor contract prices to spot prices. A positive rate indicates a bullish, potentially overheated market where longs pay shorts, while a negative rate reflects bearish sentiment where shorts pay longs—often a signal of extreme panic and a potential market bottom.
Liquidation data provides insight into the "fuel" of the derivatives market, representing positions forcibly closed by exchanges due to insufficient margin. Large-scale liquidations often trigger a "squeeze." A Short Squeeze occurs when rising prices force shorts to buy back positions to close them, further driving prices up. Conversely, a Long Squeeze happens when falling prices trigger forced selling by longs, causing a cascading downward effect.
One of the most insightful indicators is the OI/Market Cap Ratio, which quantifies the leverage load on a specific asset. For instance, if a token has a spot market cap of $1 billion and a contract OI of $1 billion, the ratio is 100%, indicating extreme speculative interest. A high ratio implies that the asset's price is heavily influenced by the derivatives market, where even minor fluctuations in spot prices can be amplified by leverage, leading to violent volatility and "wicking" price action.
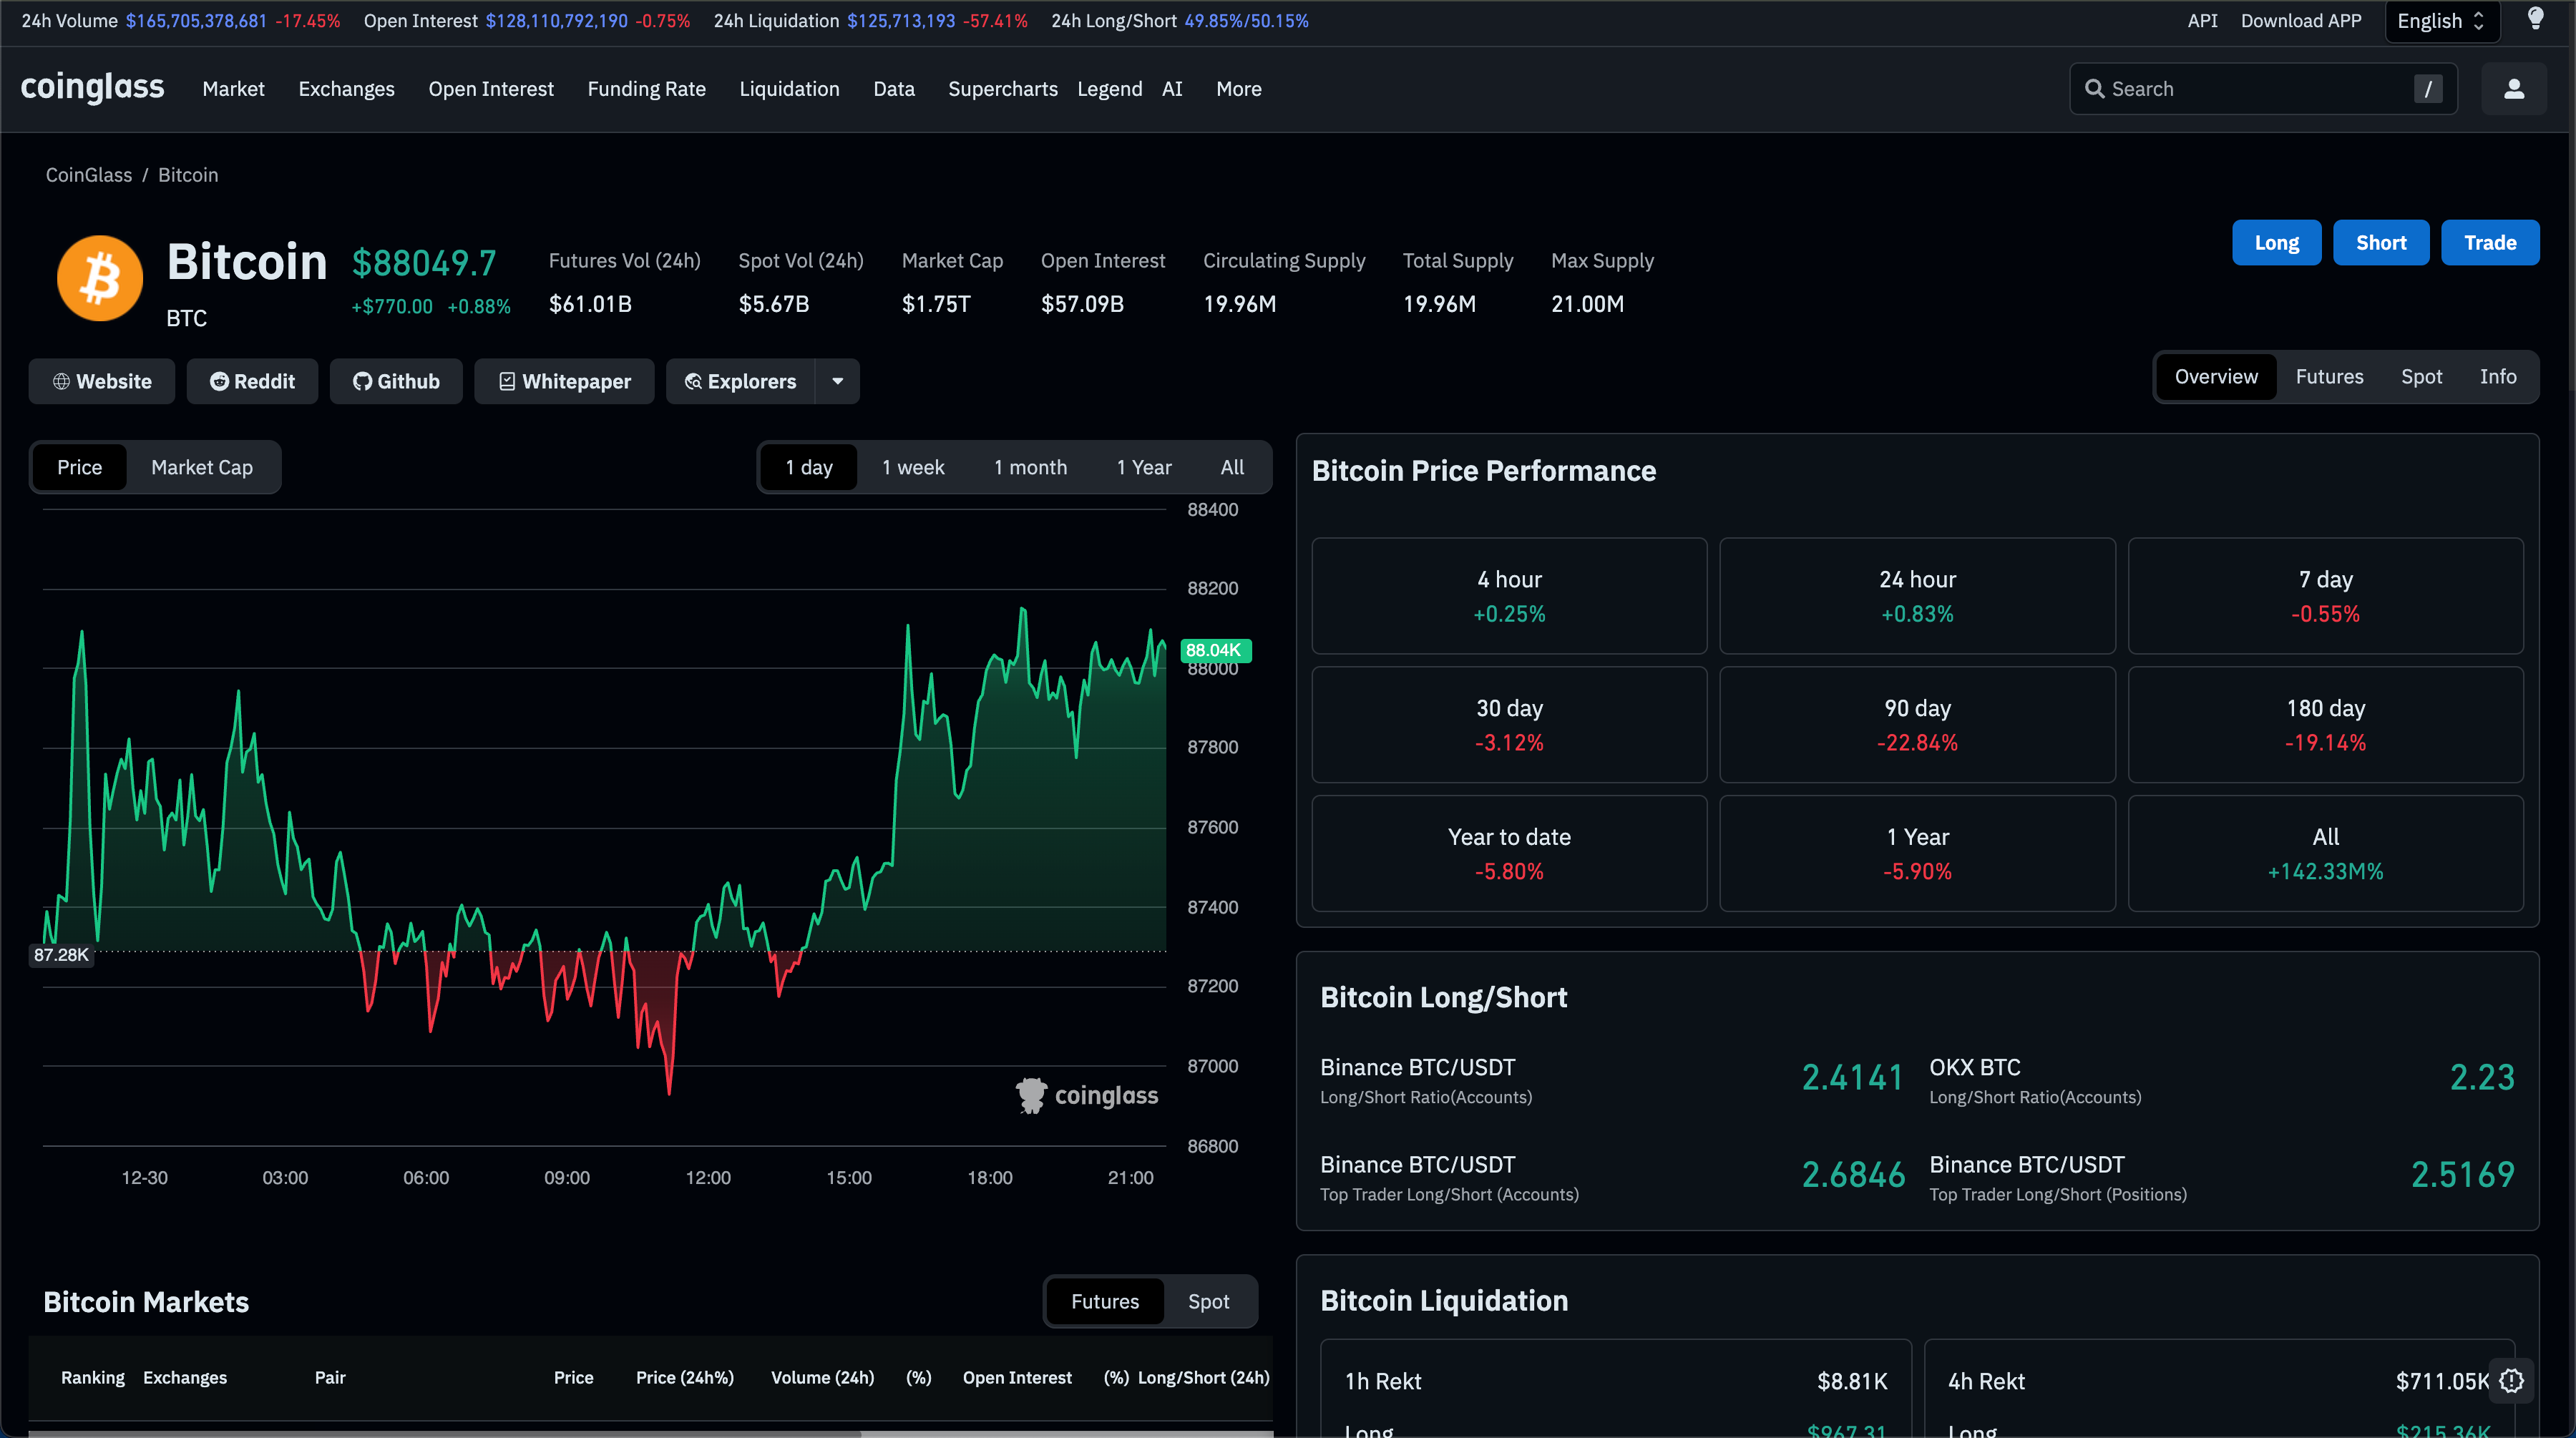
Finally, to streamline your analysis, you can add specific coins to a "Favorites" list by clicking the star icon. Selecting a specific coin reveals deeper granular data, including long/short ratios, market pairs, and capital inflows/outflows, providing a comprehensive view of the asset's fundamentals.

